Retail Sales a Net Positive for the Market Narrative, But a Net Negative for the Economy
Highlights:
|
Index: |
March: |
April: |
Wall Street Expected: |
Take Five Expected: |
|---|---|---|---|---|
|
Retail Sales: |
0.6% |
0.0% |
0.4% |
0.2% |
|
Core Retail Sales: |
0.9% |
0.2% |
0.2% |
0.2% |
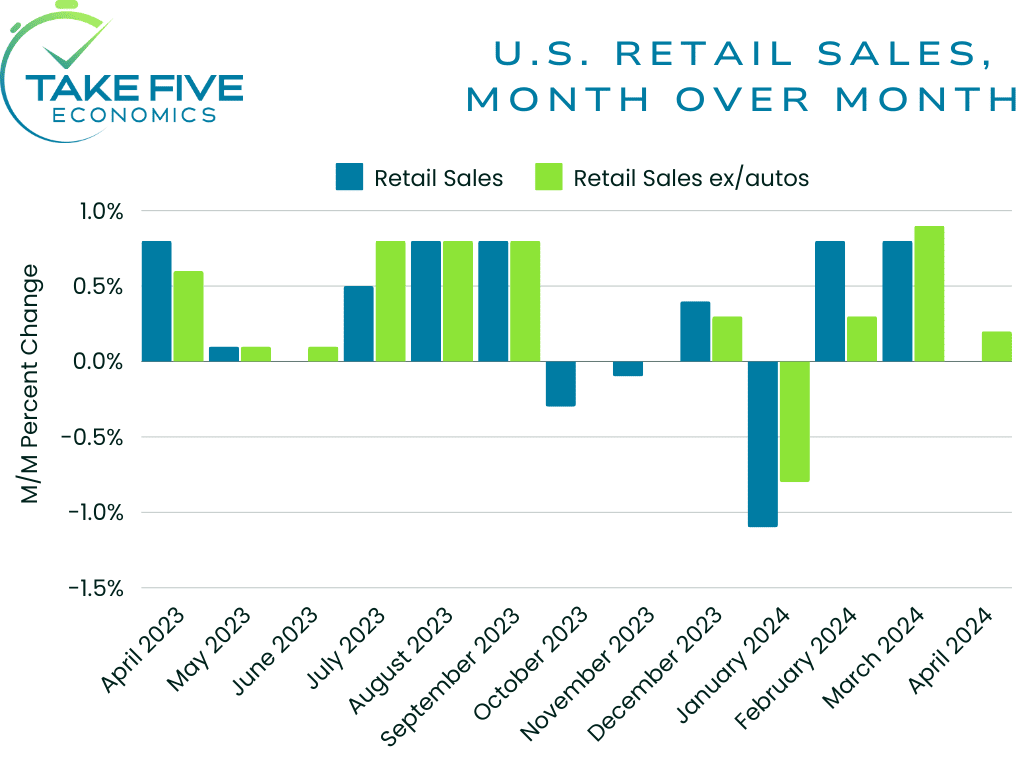
Headline retail sales came in flat in April, falling below both our own and Wall Street's expectations and followed a 0.6% rise in the prior report.
Core retail sales (ex. autos) advanced 0.2%, matching our expectations as well as Wall Street's and followed a 0.9% read in the prior report.
Finer Details:
A total of 6 out of 13 indexes advanced in April, with gasoline stations contributing to most of the advance with a 3.1% jump in the month. Among the other indexes that showed gains were clothing and clothing accessories stores (1.6%), electronics and appliance stores (1.5%), food and beverage stores (0.8%), building material supplies dealers (0.5%), and food services and drinking places (0.2%).
In contrast, e-commerce/online retail took the biggest hit in this latest report as the index fell by -1.2%. Other decliners were hobby stores (-0.9%), motor vehicle and parts dealers (-0.8%), health and personal care stores (-0.6%), furniture and home stores (-0.5%), miscellaneous stores (-0.4%), and general merchandise stores (-0.3%).
Putting It Together:
Note:
To get this out of the way, the retail sales report only contains one index regarding services, i.e. restaurants while the rest reflect purchases of goods which in recent memory reflects a smaller piece of the overall consumer outlays pie, with most coming from services.
Staples vs. Discretionary:
The shift we're seeing in the data this month is that consumers scaled back on the more discretionary purchases and focusing their wallets back towards essential purchases, e.g. gas (mostly) and food. Between higher interest rates, record household debt levels combined with more people struggling to pay off sed debt (as reported by the New York Fed today), underlying weaknesses in the labor market becoming more apparent, and of course, higher prices, Americans are getting squeezed more as time goes on which is and will continue to hurt discretionary purchases.
In the most recent consumer confidence survey, consumers felt the squeeze from higher prices in the non-discretionary areas, i.e. what dominated retail spending this month. In contrast, buying plans for homes, big-ticket appliances (e.g. furniture, cars, household appliances, etc.) and vacations all took a hit in the survey as well and continued to weaken. Consumers were also questioned regarding which purchases they would cut out in order to save money, most of which highlighted discretionary purchases.
If we're seeing prices for essential purchases rise at the same time that household savings and incomes are getting squeezed with a poor labor market outlook, then the consumer has no other option than to scale back on discretionary items. In our forecast for this report, this is what we took mostly into account since the majority of the indexes in it lean more towards the discretionary side, but we still weren't expecting a pullback to this magnitude.
Real vs. Nominal Retail Sales:
We've discussed this in different Take Five Reports as well as in a recent article, but the retail sales figures we see every month are nominal, i.e. they're not adjusted for inflation. Nominal retail sales as of this latest report are up 2.7% year over year, but when adjusted for inflation, they're actually down -0.7% year over year, meaning that consumers aren't necessarily buying more items, they're just paying more for the ones they're already buying. From our point of view, this isn't a strong consumer, and if anything reflects more weakness in the underlying fundamentals.
To Wrap It Up:
While this latest data no doubt fuels the bullish market narrative, it's still a net negative for the economic outlook as underlying fundamentals continue to get weaker and signs become more apparent as to which direction we're heading in over the long-term. When the U.S. economy has all of the glaring issues it does while its benchmark stock index is a hair below its all-time high and a Big Mac meal costs $18, it's clear that we're in a bubble and don't even get us started about everything else as we have gone down that rabbit hole one too many times lately.
This report definitely helps put another piece of the puzzle together, and there was a lot that we were able to take from this and connect the dots with other areas.