The Take Five Report: 8/18/23
I
Markets:
I-I
Global Market Recap:
United States:
- S&P: -0.77%
- Dow: -0.84%
- Nasdaq: -1.17%
- Russell 2k: -1.15%
U.S. indexes would open the day close to the breakeven mark. Prices would hover around there through the first half of the day until about 1:00, where a selloff would bring indexes down until the closing bell, ultimately causing markets to finish down once again.
Asia:
- Shanghai: -1.00%
- Hong Kong: -2.05%
- Japan: -0.55%
- India: -0.31%
Asian markets dropped in this morning’s session with Hong Kong pacing declines. Japanese core CPI fell to 3.1% YoY from 3.3% in June, while headline CPI remained flat at 3.3%. Chinese real estate giant Evergrande, who we’ve discussed before and has had nothing but trouble over the last few years, has filed for bankruptcy protection in the US. The company sought protection under Chapter 15 of the US bankruptcy code, which shields non US companies undergoing restructuring from creditors.
Europe:
- UK: -0.63%
- Germany: -0.71%
- France: -0.94%
- Italy: -1.03%
European shares dropped on Thursday, following a similar path to that of the US, with a slew of downbeat earnings weighing on sentiment. Rising bond yields across the globe rose even further, signaling central banks will keep interest rates higher for longer.
I-II
U.S. Sectors Snapshot:
- Communication Services: -0.59%
- Consumer Discretionary: -1.58%
- Consumer Staples: -1.01%
- Energy: +1.11%
- Financials: -0.50%
- Health Care: -0.76%
- Industrials: -0.84%
- Info Tech: -0.96%
- Materials: -0.18%
- Real Estate: -0.74%
- Utilities: -0.33%
II
Technicals:
II-I
Volatility Index: (VIX)
Thursday Recap:
The VIX would open the session at $16.96, and reach a low of $16.40 early on. Prices would jump rather significantly throughout the day, reaching a high of $18.13 before closing at $17.89, finishing up +6.62%.
Daily Chart:
Inertia would gain more momentum to the upside once again, this time more so than previous sessions. Strength would move in favor of the VIX bulls for the third straight session, and make a rather significant jump as they work to gain the ground they lost last week.
Prices officially touched and slightly broke above the next point of resistance, i.e. $18 approximately. The VIX bulls (market bears) have strong momentum right now, and a true breakout above this next point of resistance seems likely given the S&P’s chart as well. However, we remain weary that a false breakout may be in the cards that would at least allow a short-term pullback of VIX prices. We also must admit however that compared to other points of resistance, this one is relatively minor based on the data, and $20 would approximately be the next major point of resistance. So, we may see the rally continue to that level before we get some type of consolidation.
II-II
S&P 500: (SPX)
Thursday Recap:
The S&P would open the day a notch above Wednesday’s closing price at $4,416, and reach a high of $4,421 shortly after. Prices would decline after the stagnant first half, and reach a low of $4,364 before closing at $4,370.
Daily Chart:
Inertia would move more in favor of the bears and like the VIX, more significantly than the previous session as momentum is slowly picking up more speed. Strength moved in favor of the bears as well, marking another new low in this extremely strong cycle below the centerline.
The S&P has shattered through each level of support this week (i.e. $4,450 and $4,400). The next major point of support is at $4,300. If prices continue to decline today, we will likely be close to that mark, which we will then reassess the state of the chart and see if the bears have more gas in the tank.
III
Fundamentals:
III-I
Headlines:
1.) MarketWatch: China Evergrande collapse shows need for $1 trillion Beijing rescue plan, says Clocktower strategist
2.) MarketWatch: BofA warns of ‘unusual lack of concern’ in stock market amid rising expectations for ‘recession free’ rate cuts
3.) Bloomberg: Nomura cuts China’s growth forecast to 4.6% on ‘downward spiral'
4.) Bloomberg: China state developers warn of losses as crisis spreads
5.) Market Insider: China fuels US bond rout by slashing holdings to 14-year low
III-II
Industrial Production Data for July:
Highlights:
|
Index: |
June: |
*July: |
Wall Street Expectations: |
Take Five Expectations: |
|---|---|---|---|---|
|
Industrial Production: |
-0.8%(r) |
1.0% |
0.3% |
0.5% |
|
Capacity Utilization: |
78.6%(r) |
79.3% |
79.0% |
79.0% |
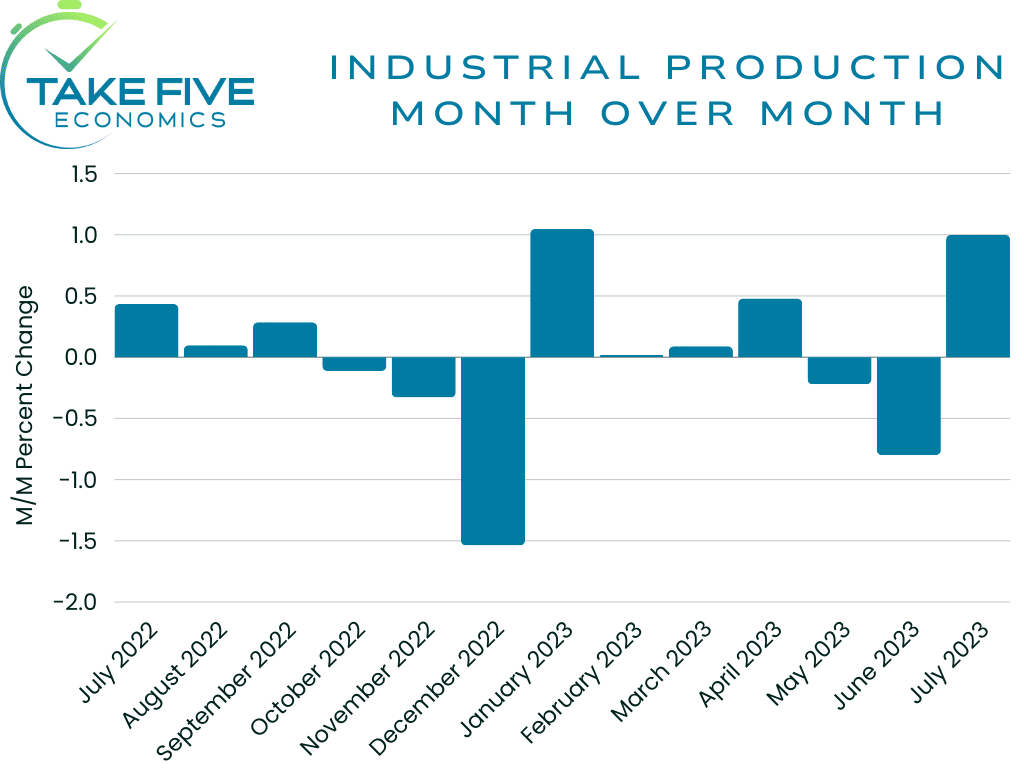
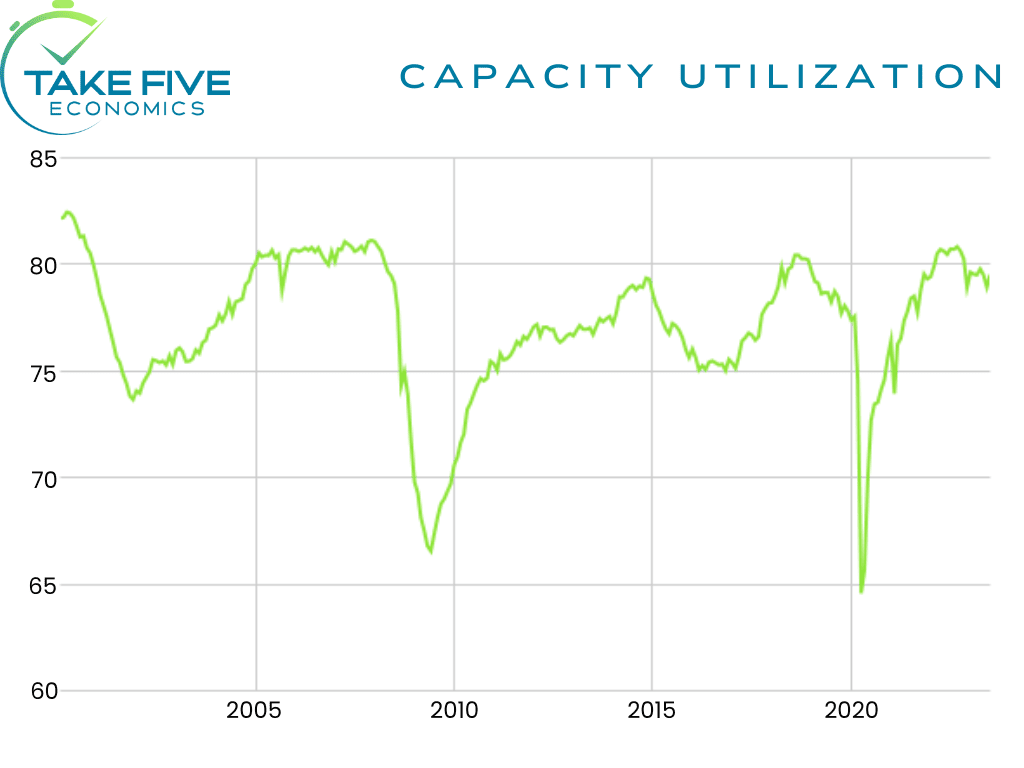
Industrial production increased 1.0% month over month in July, which beat both our own and Wall Street expectations, following a downwardly revised -0.8% decline in June from -0.5%. The capacity utilization rate jumped to 79.3%, and beat both our own and Wall Street expectations, following a downwardly revised 78.6% from 78.9% in June. Total industrial production was down -0.2% year over year while capacity utilization was -0.4% below its long run average.
Finer Details:
Most major market groups recorded growth in July. The production of consumer durables was boosted by a jump of 4.8% in the output of automotive products. Similarly, the abnormally hot weather in July lifted the indexes of energy consumer goods and energy materials, which advanced 3.7% and 2.1%, respectively. Elsewhere, there were gains of 1% in consumer nondurables, business equipment, as well as defense and space equipment. Of the major market groups, construction supplies recorded the only decline.
Manufacturing output rose 0.5% in July. However, the growth rates for the previous three months were revised down. Altogether, the index for manufacturing in July was down-0.7% year over year. In July, the indexes for durable and nondurable manufacturing increased 0.8% and 0.1% respectively. Other manufacturing (publishing and logging) advanced 1.3%.
Mining output grew 0.5% in July and was up 2.0% year over year. The output of utilities climbed 5.4%, which was bolstered by a jump of 6.7% for electric utilities.
Putting It Together:
This month's report was well above expectations. We expected an increase in production activity due to storm damage and hot weather, as well as the continuous recovery in the automotive industry but not to this extent as it shattered our expectations. However our future outlook is more pessimistic, as we believe this was an outlier due to determinants that are random acts of nature. We expect next month to be more in line with the long-term trend, i.e. downward, and our expectations will be tempered. Housing production also gave this report a boost, which would incorporate the utilities and wood product indexes. We believe home development will slow in the coming months, thus limiting the upside for these respective indexes as well.
IV
Market Psychology & Final Thoughts:
S&P futures are edging down quite significantly as we head towards the open, currently down in excess of 0.70% and dropping. Markets are spooked, and bears have taken over to say the least. With today’s $2.2 trillion worth of options expiring, we’ll see what direction the markets really want to move in. We are likely to see a lot of back and forth action. Traders move with momentum, or inertia, and right now inertia along with the rest of the technicals, fundamentals, and psychology of the market are swinging bearish. We wouldn’t be surprised to see traders load up on put options as today rambles on. We know that’s Michael Burry’s strategy. As always, we hope you found this helpful, learned a thing or two, and have a great weekend.