The Take Five Report: 8/29/23
I
Markets:
I-I
Global Market Recap:
United States:
- S&P: +0.63%
- Dow: +0.62%
- Nasdaq: +0.84%
- Russell 2k: +0.83%
U.S. markets opened yesterday’s session in the green and would reach their daily highs within the first hour of the session. However, trading remained flatlined for the rest of the session, as premarket gains stalled after the opening bell.
Asia:
- Shanghai: +1.20%
- Hong Kong: +1.95%
- Japan: +0.18%
- India: +0.12%
Asian stocks advanced in this morning’s session, once again led by Chinese markets following the aid and measures to boost equity prices. Japan’s unemployment rate came in higher than expectations, at 2.7% compared to 2.5% expected.
Europe:
- UK: closed
- Germany: +1.03%
- France: +1.32%
- Italy: +1.19%
European markets continued to rally throughout their session, and not give up early gains like they have been as of recently. France led the region in gains, while the region was lifted overall on strong volume seen in their tech sector.
I-II
U.S. Sectors Snapshot:
- Communication Services: +1.05%
- Consumer Discretionary: +0.37%
- Consumer Staples: +0.46%
- Energy: +0.73%
- Financials: +0.59%
- Health Care: +0.23%
- Industrials: +0.79%
- Info Tech: +0.81%
- Materials: +0.74%
- Real Estate: +0.77%
- Utilities: -0.04%
II
Technicals:
II-I
Volatility Index: (VIX)
Monday Recap:
The VIX would open Monday’s session at $16.24, and only work to a high of $16.28 shortly after. Prices declined throughout the session, falling to a low of $15.00 before closing at $15.08, falling -3.83% on the day.
Daily Chart:
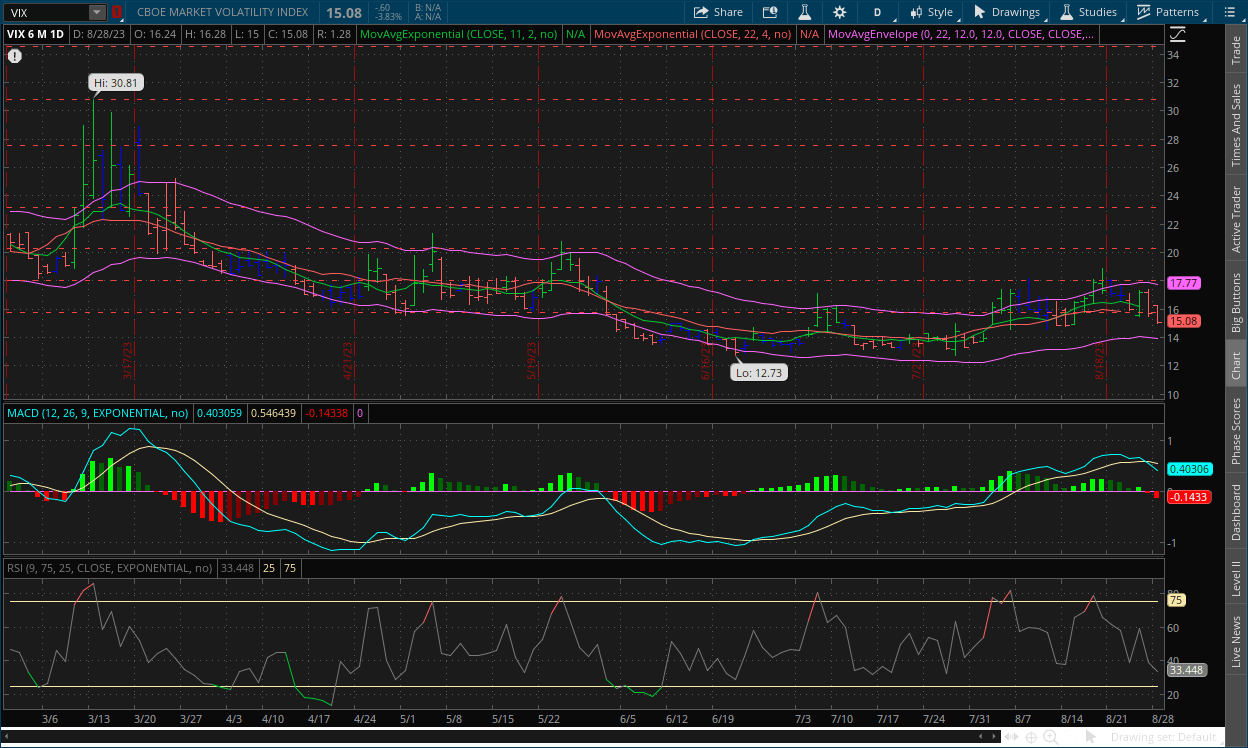
Strength would move in favor of the VIX bears and fall lower below the centerline as the party made a strong push in today’s session. Inertia would also edge downward as the VIX bears gain more momentum following the breakout below $15.78 support level.
The breakout below the $15.78 level was accompanied by strong momentum by the VIX bears, and given the increased momentum from the market bulls, we're likely to see prices continue to slide as market participants are reacting positively to Powell’s neutral stance, as well as the positioning of the MACD-H relative to the centerline and its current momentum.
II-II
S&P 500: (SPX)
Monday Recap:
The S&P would open higher compared to Friday’s close at $4,426, and reach a high of $4,439 fairly early on. Prices would slide around midday and reach a low of $4,414 before rallying back strongly and closing at $4,433.
Daily Chart:
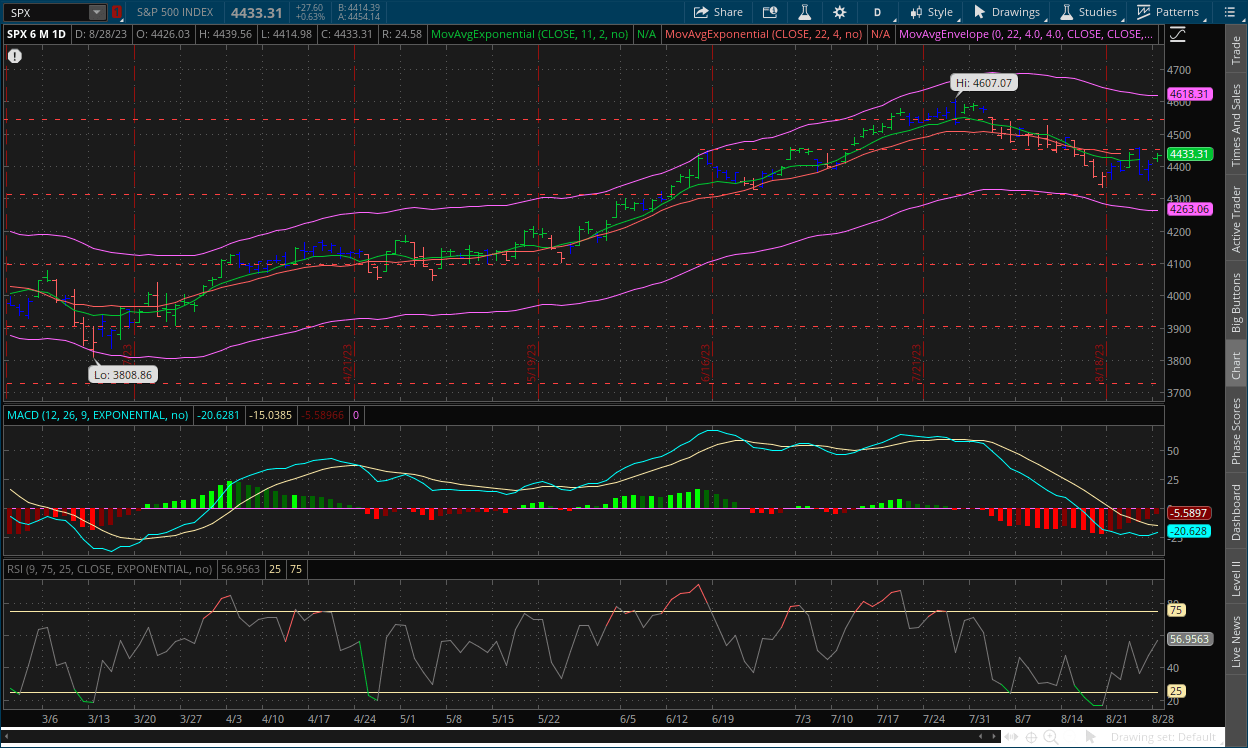
Strength would move in favor of the bulls for the sixth straight session as their momentum continued yesterday, nearly bringing the MACD-H back to the centerline. Inertia would move in favor of the bulls as well, but is still relatively flat over the last few sessions as prices have been overall consolidating.
The S&P will likely see its own breakout above the $4,450 level in today’s session. We said the market direction would largely depend on Powell’s speech, and if it is taken positively, a deeper pullback may be in order. We still stand by our longer-term analysis however.
III
Fundamentals:
III-I
China's Economy - Debt & Real Estate:
Background:
The GFC in 2008 kicked off what economists call a “debt supercycle”, which spread to Europe in 2010 and has now engulfed much of the rest of the world, including many low and middle income nations. Until recently, China has managed debt and different crises exceptionally well. But the significant slowdowns in growth combined with accelerating debt levels within local governments and real estate along with possible deflationary trends, it creates a potential headwind that may wind up being unavoidable.
Debt Fueled Growth:
China’s current problems can be linked back to its massive amount of investment stimulus following the GFC in 2008. This fueled China’s growth over the last 15 years, with a significant portion fueling the real estate construction boom. After years of building housing and offices at unprecedented speed due to the system they had in place, i.e. they would finance construction by using presale mortgages on unfinished real estate. They would then use the money received from presale rounds to finance additional presale loans and pay off older presale loans, essentially creating a ponzi scheme around the entire concept.
Everyone and their mother know this isn’t a good idea. But because demand was so high compared to the supply, prices kept appreciating at a rapid rate. Future residents thought if they start paying presale mortgages for their homes and spaces, that by the time construction was complete, prices would have already appreciated enough in value, essentially forming a speculative bubble within their housing sector similar to 2008. But the “investors” didn’t take into account what would happen if demand were to slow. The only reason why this worked is because prices were appreciating so quickly and people kept fueling the market. When property developers couldn’t keep up with demand (i.e. weren’t finishing projects on time), demand slowed. When demand slowed, the property developers didn’t have the capital in order to actually finish their projects, which caused the bubble to start bursting.
Real Estate takes up around 30% of China’s GDP, and the bubble that started bursting in mid 2022, is finally starting to take its true effect. Chinese property developer Evergrande, formerly the largest in the country, reopened trading after 17 months of being halted just the other day, only to lose -87% of its market value. Their other largest real estate developer, Country Garden, just last week filed for chapter 15 bankruptcy.
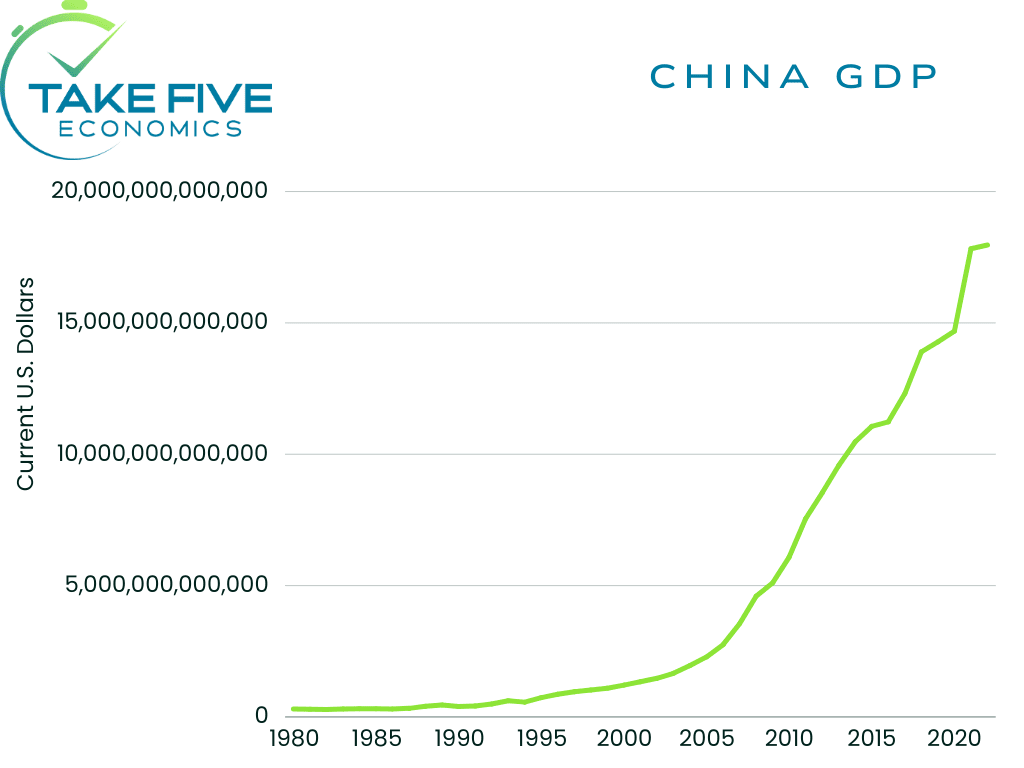
As you can see, China has grown at an unprecedented rate since 2008, and as you’ll see in the next chart, it has been mostly financed through debt in which again, a significant portion was through real estate development.
Putting It Together:
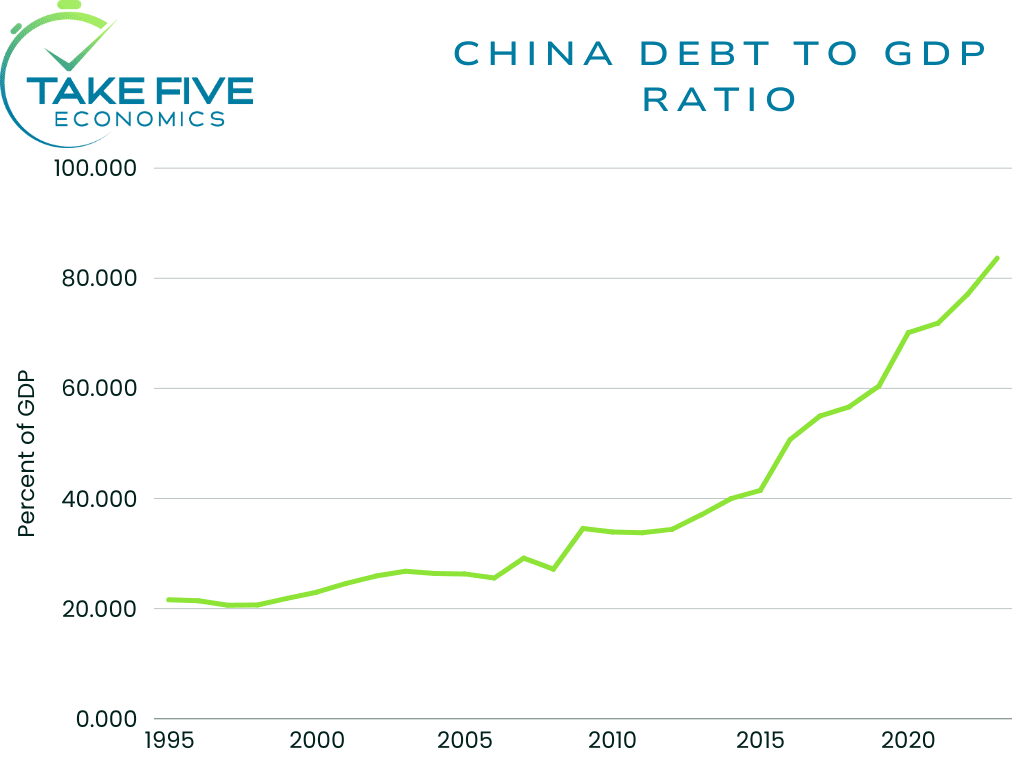
China’s debt to GDP ratio is roughly 80%, some analysts say it could be as high as 90% at the current moment in time, but it’s hard to get an exact figure. It may not be as high as the U.S.’ (130%), but it’s growing at an alarming rate, and because a lot of the debt is concentrated within one sector of the economy (which also happens to contribute the most to their GDP), it creates a potential 2008 style bust scenario for the world’s second largest economy. Not to mention the other issues plaguing China's economy, e.g. slowing trade, slowing agriculture, etc. that we will discuss in future reports. China has kicked the can down the road for a very long time, the question is, can they successfully do it again? Time will tell.
IV
Market Psychology & Final Thoughts:
Futures are still trending higher as we head towards the open, and overseas markets are also on the rise, showing we’re likely in for a green open today. Tomorrow’s report will contain analysis on the JOLTS - Job openings report. As always, we hope you found this helpful, learned a thing or two, and have a great day.