The Take Five Report: 8/30/23
I
Markets:
I-I
Global Market Recap:
United States:
- S&P: +1.45%
- Dow: +0.85%
- Nasdaq: +1.74%
- Russell 2k: +1.42%
U.S. markets advanced in yesterday’s session, led by Magnificent Seven stocks, following the JOLTS data released before the opening bell. JOLTS came in well below expectations, but markets took that as the Fed now has less justification to continue hiking interest rates. A lower consumer confidence rating of 106.1 compared to 114 in the previous report along with a -1.2% drop in the Case-Shiller home price index also eased markets into that conclusion.
Asia:
- Shanghai: +0.04%
- Hong Kong: -0.01%
- Japan: +0.33%
- India: +0.02%
Asian markets closed mostly flat in this morning’s session after two strong days of rallying to start the week as the bulls decide to take a breather. Australia led the region in gains, advancing +1.21% and reaching a two-week high.
Europe:
- UK: +1.72%
- Germany: +0.88%
- France: +0.67%
- Italy: +1.21%
European markets advanced universally in yesterday’s session, as global market momentum didn’t leave the region behind with all sectors and industries logging positive days. The UK’s FTSE 100 index would pace the region in gains after being closed for holiday on Monday.
I-II
U.S. Sectors Snapshot:
- Communication Services: +2.46%
- Consumer Discretionary: +2.35%
- Consumer Staples: +0.41%
- Energy: +0.30%
- Financials: +0.88%
- Health Care: +0.83%
- Industrials: +0.78%
- Info Tech: +2.11%
- Materials: +1.68%
- Real Estate: +1.15%
- Utilities: +0.28%
II
Technicals:
II-I
Volatility Index: (VIX)
Tuesday Recap:
The VIX would open Tuesday’s session at the breakeven mark (i.e. Monday’s closing price) of $15.08, and work to a high of $15.30 shortly thereafter. Prices would once again slide in yesterday’s session, falling to a low of $14.34 before closing at $14.45, dropping -4.18%.
Daily Chart:
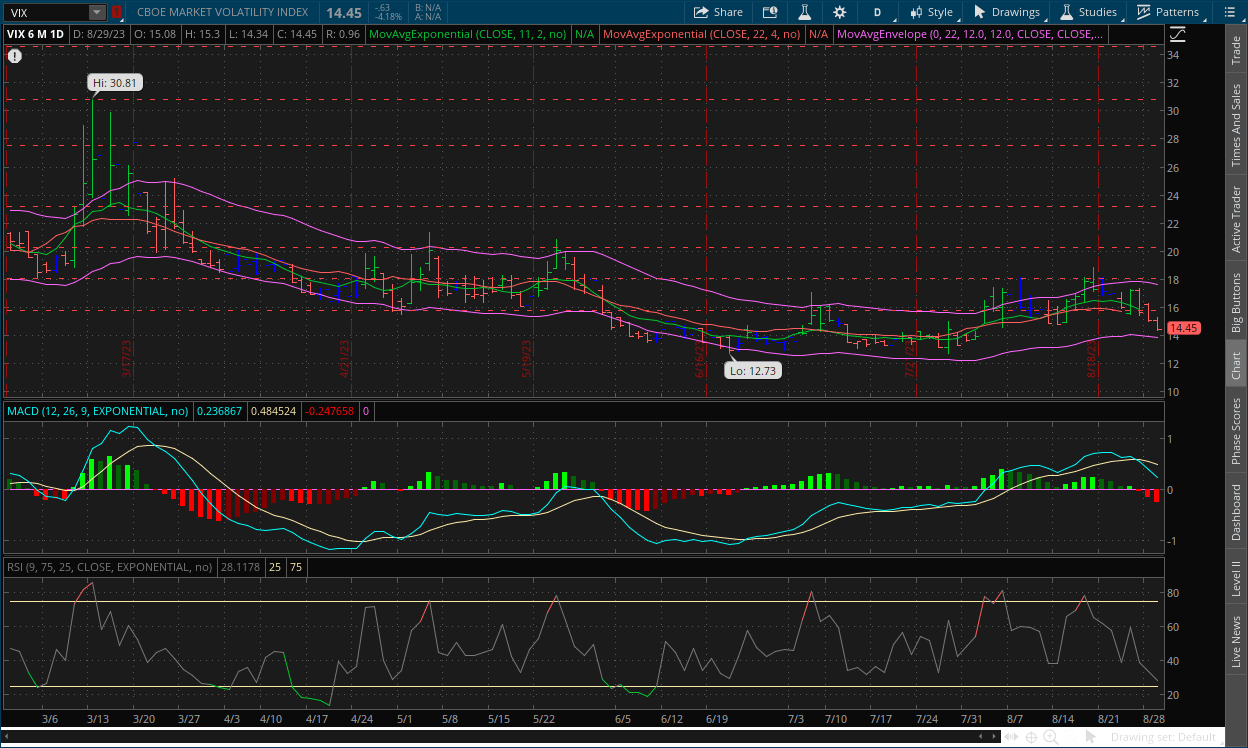
Strength would move in favor of the VIX bears for the third straight session, and continue the strong descent below the centerline as the major catalysts that have gone by so far, i.e. Jackson Hole, JOLTS, and Consumer Confidence have been largely bullish for markets, despite the fact that the data (i.e. fundamental) is getting worse. Inertia would continue to move in favor of the VIX bears as prices continue to decline. Based on price action, the VIX has all the makings of a true breakout below the $15.78 support level, with bullish catalysts adding more fuel to the drop making the $13 level the more likely consolidation point.
II-II
S&P 500: (SPX)
Tuesday Recap:
The S&P would open Tuesday’s session right around breakeven at $4,432, with the low being a tick lower at $4,431. Prices would rally throughout the session, reaching a high of $4,500 right before the bell, and officially closing at $4,497.
Daily Chart:
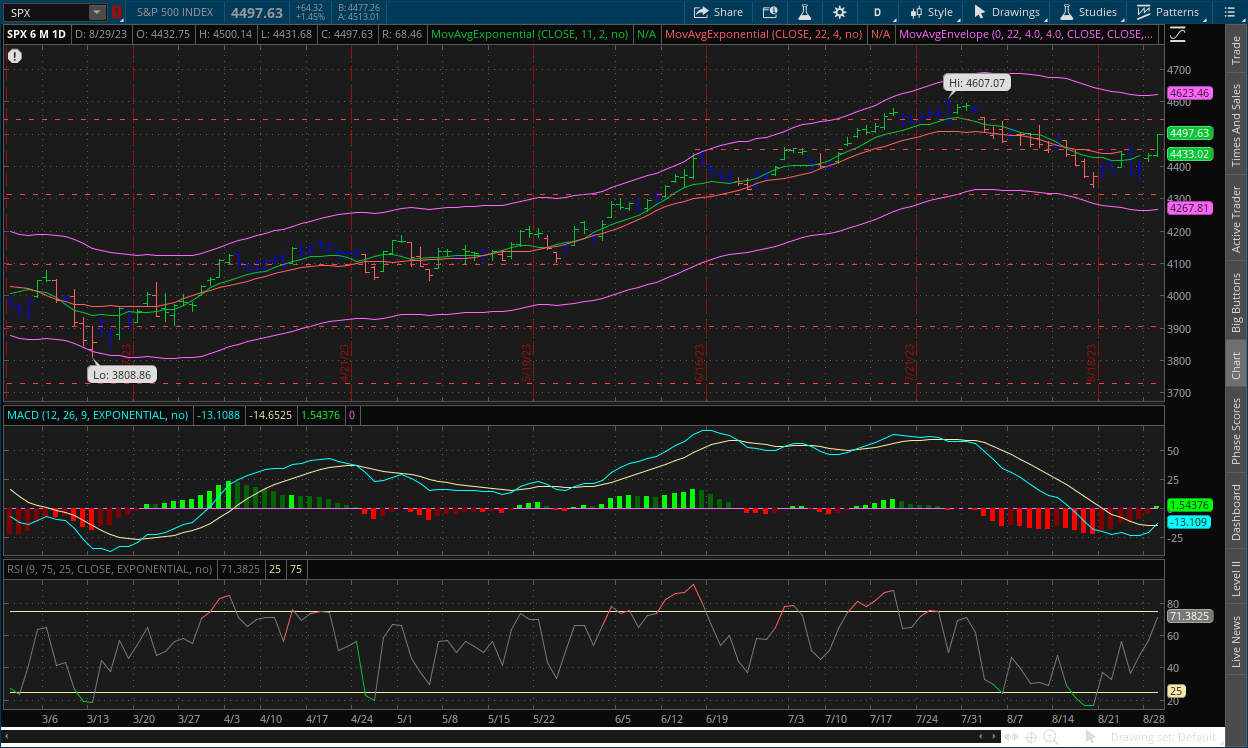
Strength would move in favor of the bulls for the seventh straight session, and would successfully move the MACD-H above the centerline, which was accompanied by a crossover of the MACD Lines as well. Inertia would edge more in favor of the bulls once again as the rally continues. As said above, based on the price action and the momentum that bulls have at the moment, the breakout above the $4,450 resistance level looks to be a true breakout. We said prices either way would likely pull back to the $4,450 level, the recent catalysts may just add a little more fuel to the fire as they are with the VIX.
III
Fundamentals:
III-I
Headlines:
1.) MarketWatch: Global dividends hit record $568 billion, but pace of U.S. payouts slow for sixth straight quarter
2.) MarketWatch: Nvidia’s stock closes at record high, sending AI-chip maker to $1.2 trillion market cap
T5 note: overvalued
3.) Bloomberg: China developer Vanke profit slides -19% amid property woes
4.) Financial Times: China expands farmland in bid to cut foreign food reliance
III-II
JOLTS Data for July:
Highlights:
|
Index: |
June 2023: |
July 2023: |
Wall Street Expectations: |
Take Five Expectations: |
|---|---|---|---|---|
|
Job Openings: |
9.165m(r) |
8.827m |
9.559m |
8.5m |
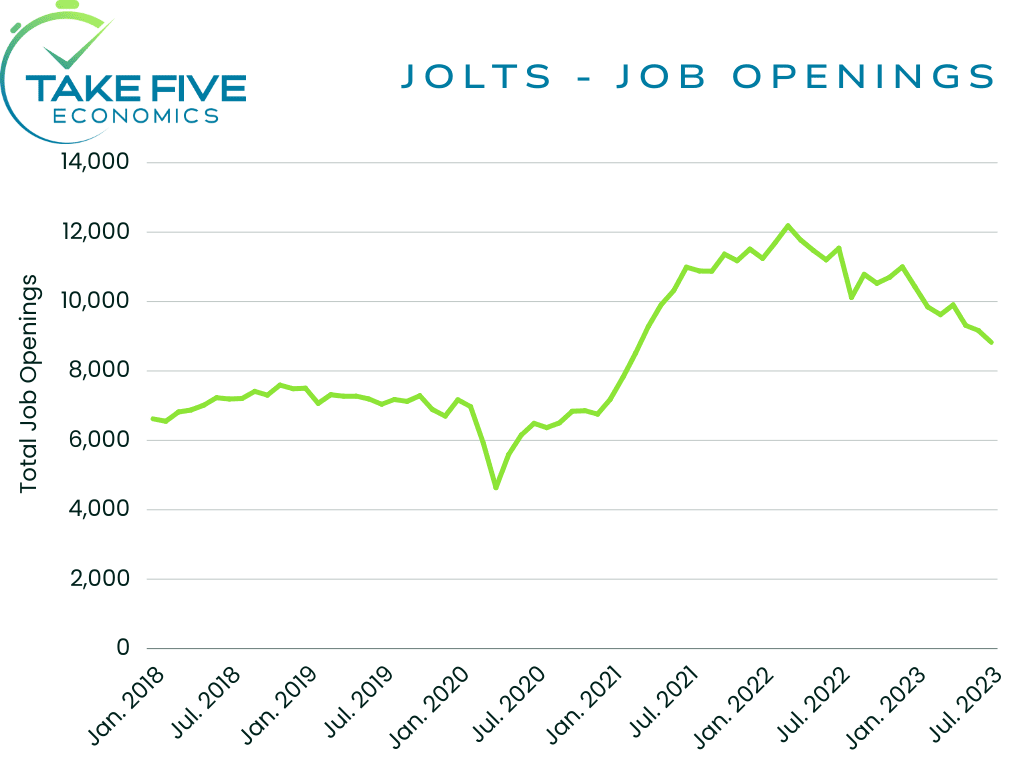
The number of Job Openings edged down to 8.827m in July, falling short of Wall Street expectations while beating our own. Our estimates are based on the notion that this report will be revised down in the coming month, as every report this year relating to the labor market has been revised down to some degree, with last month’s being revised from 9.824m openings to 9.165m.
Finer Details:
Job Openings:
Job openings decreased in professional and business services (-198,000); health care and social assistance (-130,000); state and local government, excluding education (-67,000); state and local government with education (-62,000); and federal government (-27,000). By contrast, job openings increased in information (+101,000) and in transportation, warehousing, and utilities (+75,000).
These are figures that the Fed will be pleased to see, as this is the direction they want the labor market to be heading in, i.e. tightening. The less job openings there are, means the less businesses are hiring. We’ve been discussing the labor market in depth in recent weeks, and we’ve been seeing this trend slowly start to unfold.
An important statistical note: There were 1.51 job openings for every unemployed worker in July, the lowest such ratio since September of 2021. Again meaning, the labor market is tightening. Our outlook for the labor market, and for the rest of the economy for that matter, is much more bearish than most, but we stand by it nonetheless. We’ll likely see the number of job openings continue to wane in the coming months.
Hires:
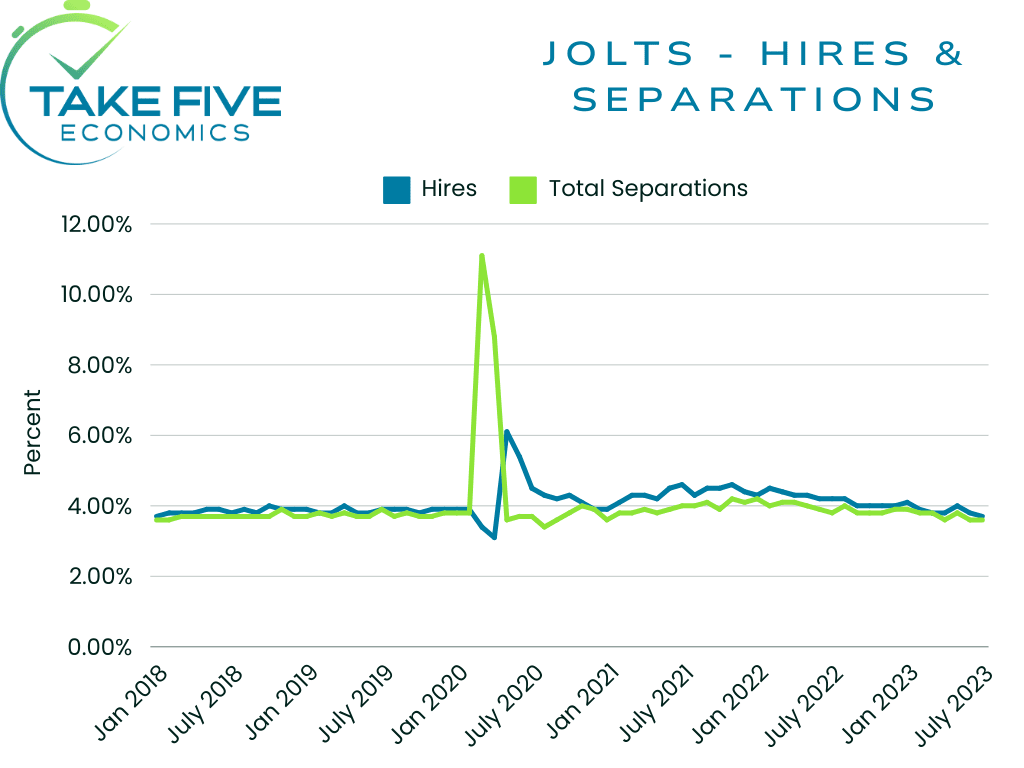
The number and rate of hires changed very little month over month, at 5.8m and 3.7% respectively, with the number of hires also changing little across all industries. We’ve seen the trend of hires also start to temper as well, as we’ve seen and discussed through earnings transcripts of job recruiting companies and other reports. Companies have slowed hiring to a fair degree, and hiring momentum is cooling significantly.
Separations:
Total separations include quits, layoffs and discharges, and other separations. Quits are generally voluntary separations initiated by the employee. Therefore, the quits rate can serve as a measure of confidence in the labor market, i.e. they’re more likely to quit if they believe they’re able to find another and/or better job.
The number and rate of total separations in July also changed very little month over month, at 5.5m and 3.5% respectively. The number of quits decreased to 3.5m (-253,000), while the rate moved slightly to 2.3%. The number of layoffs and discharges moved slightly to 1.6m, and the rate held steady at 1%. The number of other separations in July was 378,000.
Putting It Together:
As we said above, these are numbers the Fed and the market will be pleased to see. The JOLTS data looks to be heading back towards its longer-term average, but with the data showing that the overall labor force is still increasing, along with an increasing number of immigrants coming in making it harder to find and transfer jobs, we'll have to wait and see how these and other factors effect the labor market moving forward.
IV
Market Psychology & Final Thoughts:
Futures are still close to breakeven as we head towards the open. Fundamental data is getting worse, but markets are taking that as a bullish signal because it gives the Fed less inclination to raise rates again. This is what we at Take Five call a speculative market, as it goes against the fundamental aspects which are what drive prices in the long term. As our formula goes: Technicals + Fundamentals = Psychological. The psychological force is what truly drives current market prices, as it is the most powerful force and is constantly shifting. As we see it, fundamental data will continue to get worse. Eventually however, markets won’t be able to take it positively anymore, as they are being too short sighted and ignoring the larger picture. As always, we hope you found this helpful, learned a thing or two, and have a great day.