The Take Five Report: 9/15/23
I
Markets:
I-I
Global Market Recap:
United States:
- S&P: +0.84%
- Dow: +0.96%
- Nasdaq: +0.81%
- Russell 2k: +1.40%
U.S. markets opened the session hot, with all major indexes opening the session over +0.40% following the release of the PPI and retail sales reports. Markets despite the less than favorable reads would continue to rally throughout the session, with a slight leveling off in the final hour of trading.
Asia:
- Shanghai: -0.28%
- Hong Kong: +0.75%
- Japan: +1.10%
- India: +0.47%
Asian markets finished mostly higher this morning, with mainland China slipping despite strong data out of there. Industrial production rose by 4.5% year over year, with retail sales climbing 4.6% versus a 3% expectation. The unemployment rate ticked down to 5.2%, fixed asset investment grew by 3.2%, and the People’s Bank of China held rates at 2.5%. However GDP forecasts for the world’s second largest economy were revised down to 5%, and 4.5% for 2024.
Europe:
- UK: +1.95%
- Germany: +0.97%
- France: +1.19%
- Italy: +1.37%
European markets rallied significantly in yesterday’s session following the ECB’s surprise 25 basis point rate hike. The UK paced the region in gains despite the poor fundamental data released this week, and the same is true for the rest of the region.
I-II
U.S. Sectors Snapshot:
- Communication Services: +1.18%
- Consumer Discretionary: +0.88%
- Consumer Staples: +0.82%
- Energy: +1.26%
- Financials: +0.87%
- Health Care: +0.25%
- Industrials: +0.99%
- Info Tech: +0.70%
- Materials: +1.40%
- Real Estate: +1.71%
- Utilities: +1.47%
II
Technicals:
II-I
Volatility Index: (VIX)
Thursday Recap:
The VIX opened the session at $13.39, and reached a high of $13.46 shortly thereafter. Prices would slide throughout the session, reaching a low of $12.79 shortly before closing at $12.82.
Daily Chart:
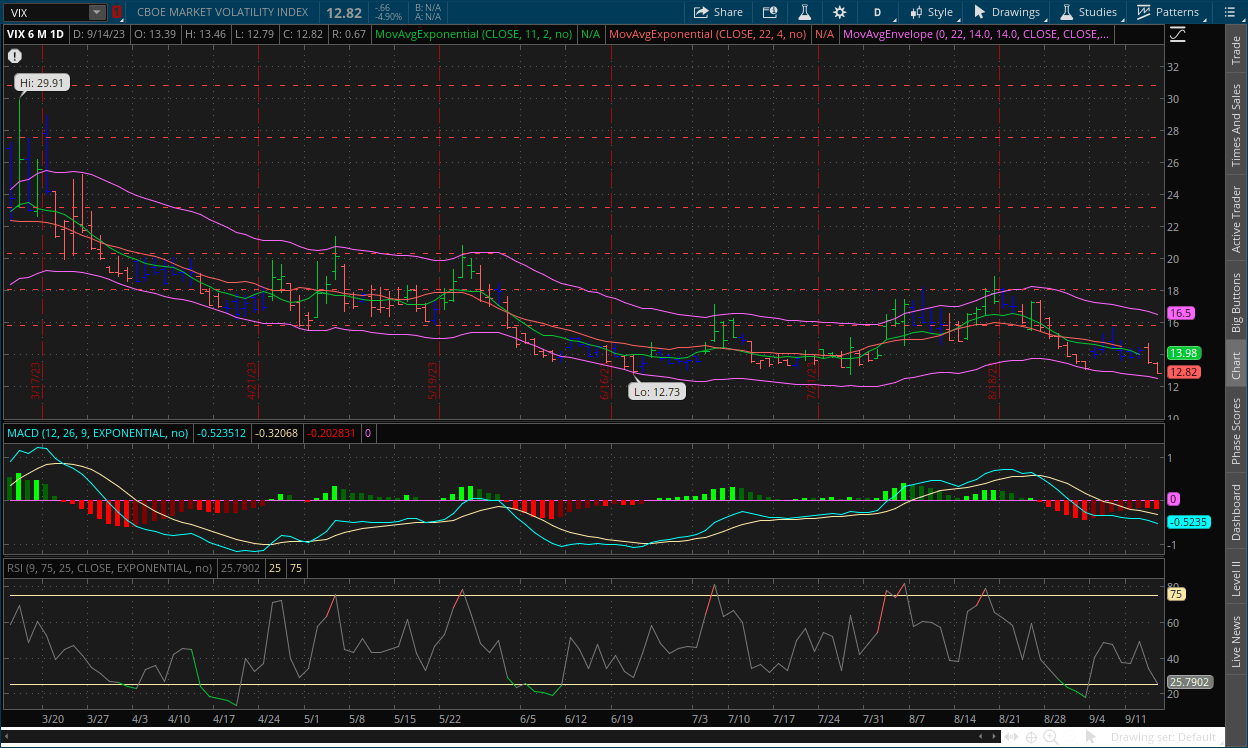
Strength would move in favor of the VIX bears for the second straight session, as the VIX bulls look as if they may have lost their momentum in their bid back above the centerline. Inertia would move more in favor of the VIX bears, as prices are picking up speed in that direction.
Yesterday’s session was interesting to say the least. Volatility decreased in markets on a day where higher volatility was implied following the hotter than expected PPI and retail sales reports. This may be looked at as a final push from the VIX bears (i.e. market bulls) in this cycle. This would mean the breakout below $13 would be false. That being said, the VIX bulls may offer the markets a correction in the near future.
II-II
S&P 500: (SPX)
Thursday Recap:
The S&P jumped during premarket trading, causing the index to open at $4,487 compared to Wednesday’s close of $4,467. Prices reached a low of $4,478 early on, and would steadily rally throughout the session and reach a high of $4,511 before closing at $4,505.
Daily Chart:
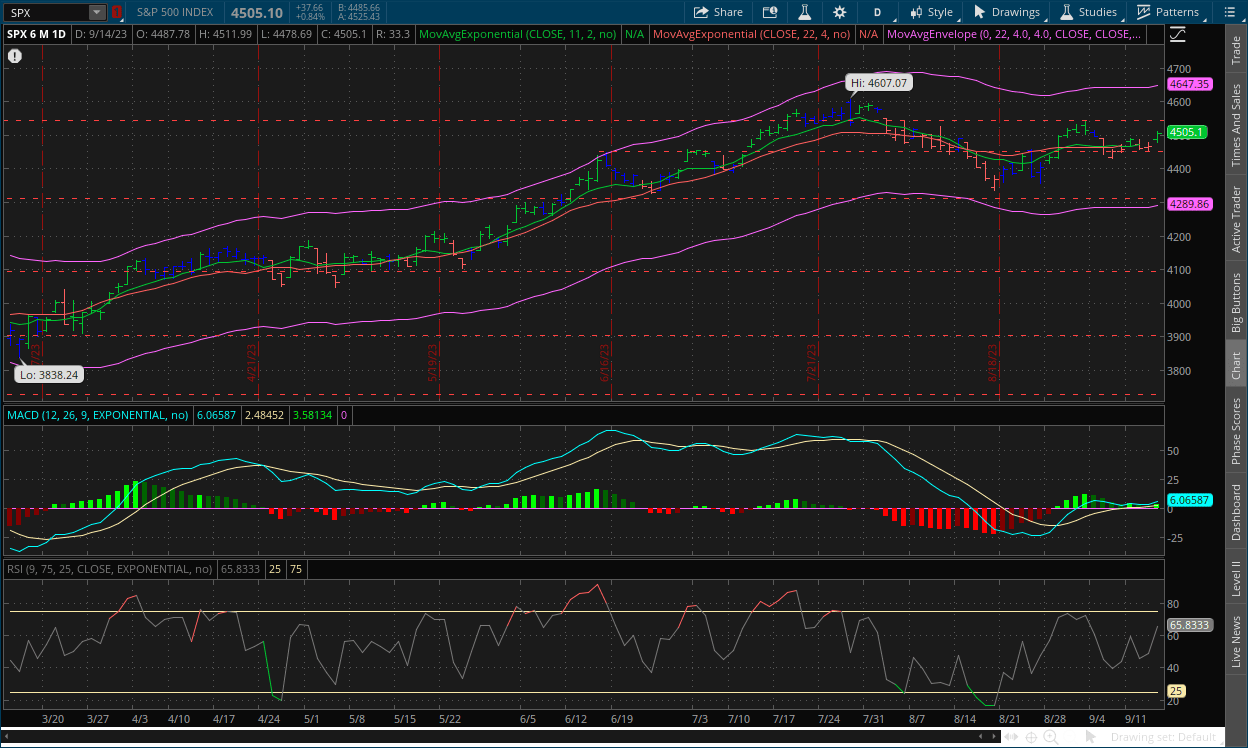
Strength would move in favor of the bulls in yesterday’s session, as the bears have failed to make any significant strides in retaking the centerline over the last week. Inertia would edge back in favor of the bulls, but still remain flat overall.
Markets had a bizarre reaction towards the less than stellar data regarding the PPI and retail sales reports. Over the last two years, anything that has been considered inflationary has been met with market selloffs. However, as we said above in our analysis of the VIX, this may be looked at as a final push by the bulls to try and break through the resistance level, and any break above that point would be false. The weakness in the bulls is reflected clear as day in the technical signals, so we may be looking at the start of a shift in momentum. The head and shoulders pattern is also an indication of a potential reversal, as this chart pattern will typically appear at the end of rallies.
III
Fundamentals:
III-I
August PPI Data:
Highlights:
|
Index: |
July 2023: |
August 2023: |
Wall Street Expectations: |
Take Five Expectations: |
|---|---|---|---|---|
|
Headline PPI: |
0.3% |
0.7% |
0.4% |
0.5% |
|
Core PPI: |
0.3% |
0.3% |
0.2% |
0.3% |
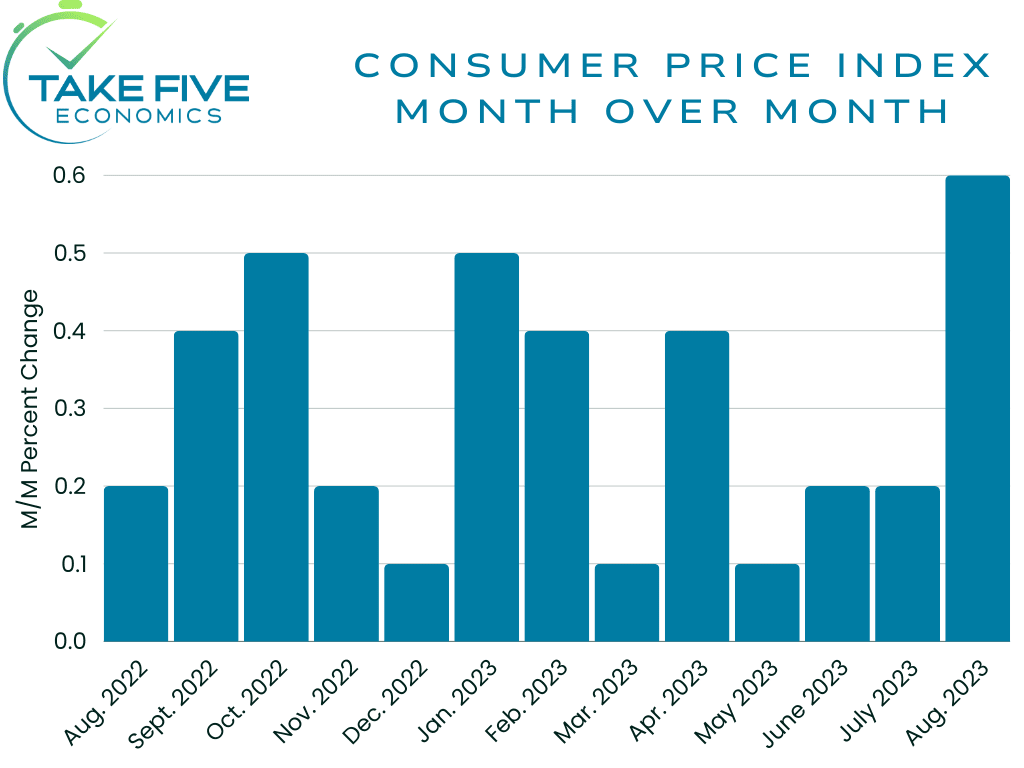
Month over Month:
Headline PPI (i.e. final demand) increased by 0.7% month over month, the largest increase in 14 months, and came in above both Wall Street and our own expectations. This followed a 0.3% increase in July. Core PPI increased 0.3% month over month, which matched our expectations and more than Wall Street’s.
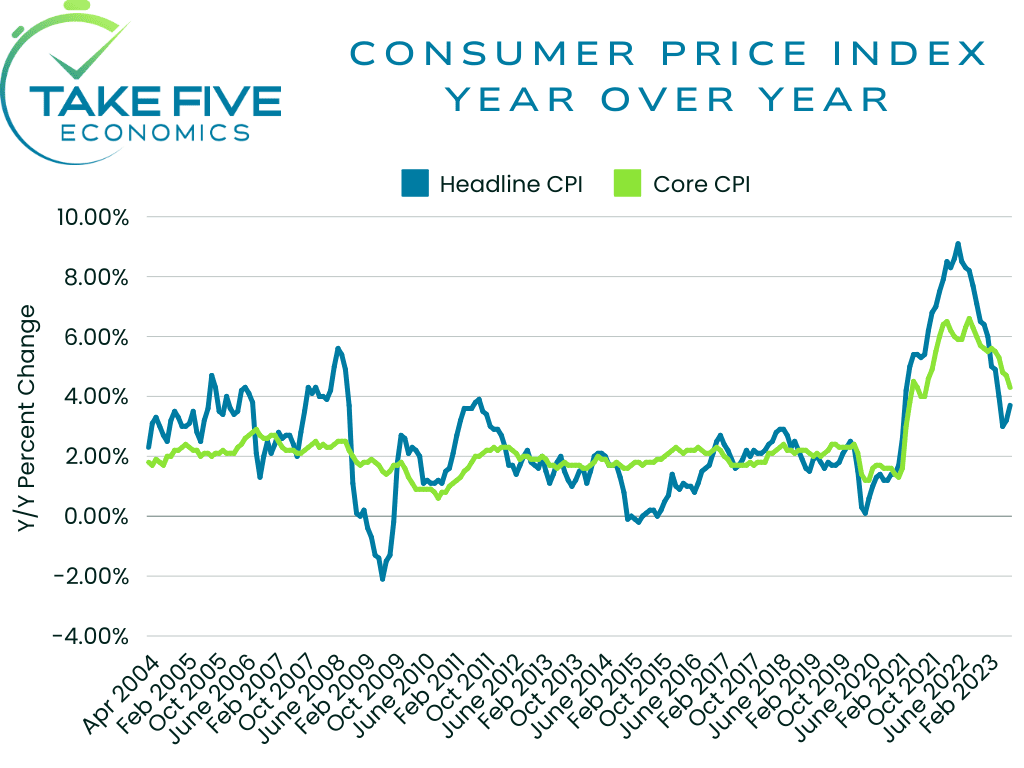
Year over Year:
The index for final demand (headline PPI) jumped to 1.6% year over year compared to 0.8% in July. Core PPI ticked up to 3.0% year over year compared to 2.9% in July.
Finer Details:
Final Demand Goods:
The index for final demand goods jumped by 2.0% in August, the largest advance again, in 14 months. The rise this month was largely because of the jump in final demand energy, which surged 10.5%. In contrast, final demand foods declined -0.5%. Core final demand edged up marginally, only 0.1% in August compared to 0.0% in the prior report.
Over 60% of the rise in this report can be traced to gas prices, which surged a staggering 20.0%. Other energy indexes, e.g. diesel fuel, jet fuel, and home heating oil also moved higher. Some other notable increases were the indexes for beverage and beverage materials, as well as iron and steel scrap. Notable declines included prices for fresh and dry vegetables at -11.5%, as well as residential electric power and industrial chemicals.
Final Demand Services:
The index for final demand services rose 0.2% in August, tempering from a 0.5% advance in July. Core final demand services, which excludes trade, transportation, and warehousing moved up 0.3%. The index for final demand transportation and warehousing services jumped by 1.4%, while margins for final demand trade services declined by -0.3%.
A 1.1% advance in the index for residential real estate services played a major role in the climb in prices for final demand services. The indexes for truck transportation and freight; machinery, equipment, parts and supply wholesaling; automotive fuels and lubricant retailing; services related to securities brokerage and dealing (i.e. financial services); and residential real estate loans all notably advanced higher. The only notable declines were chemicals and allied products wholesaling, as well as food wholesaling.
Putting It Together:
Combining the two indexes (i.e. final demand goods and final demand services), about 80% of the advance was contributed by the 2.0% jump in final demand goods, which again, was largely driven by the rise in energy, and more specifically, gas prices. Many of the industries we expected to be affected also rose in this report, e.g. shipping and freight, transportation, etc. The core figures remained tempered compared to the headline figures, which is a good thing. The Fed themselves say that it will take longer than expected for inflation to reach their 2% target, and they’re expecting a few bumps along the way. While we are concerned about the potentially persistent trend of higher energy costs and the effects they’ll have on other industries, we remain cautiously optimistic about our outlook in terms of inflation.
IV
Market Psychology & Final Thoughts:
Futures are still trending down as we head towards the open. As said above, the markets may correct itself from the overreaction in yesterday’s session, and this is shaping up to be a potential final push by the bulls. Today, we have the industrial production and capacity utilization report, which will be covered along with the retail sales report on Monday, as well as the Empire State Manufacturing survey. As always, we hope you found this helpful, learned a thing or two, and have a fantastic weekend.