The Take Five Report: 9/18/23
I
Markets:
I-I
Global Market Recap:
United States:
- S&P: -1.22%
- Dow: -0.83%
- Nasdaq: -1.56%
- Russell 2k: -1.05%
U.S. markets following the bizarre Thursday rally would correct themselves on Friday. The open was around breakeven, but prices would sell off continuously throughout the day and close just off their lows.
Asia:
- Shanghai: +0.26%
- Hong Kong: -1.39%
- Japan: closed
- India: -0.36%
Asian markets were mixed this morning as market participants look ahead to a week of central bank decisions (see section IV). Hong Kong paced the region in declines after slipping in its final hour, while mainland Chinese markets managed to withstand the broader selloffs.
Europe:
- UK: +0.50%
- Germany: +0.56%
- France: +0.96%
- Italy: +0.08%
European markets marched higher on Friday amid optimism that the ECB has finished raising interest rates following the 25 basis point hike the day prior. The decision had markets on their toes, as it was unexpected. Borrowing costs in the euro zone were brought to a record high, but the takeaway investors got was rather dovish.
I-II
U.S. Sectors Snapshot:
- Communication Services: -1.11%
- Consumer Discretionary: -1.88%
- Consumer Staples: -0.82%
- Energy: -1.32%
- Financials: -0.55%
- Health Care: -0.74%
- Info Tech: -1.95%
- Materials: -1.09%
- Real Estate: -0.51%
- Utilities: -0.49%
II
Technicals:
II-I
Volatility Index: (VIX)
Weekly Chart:
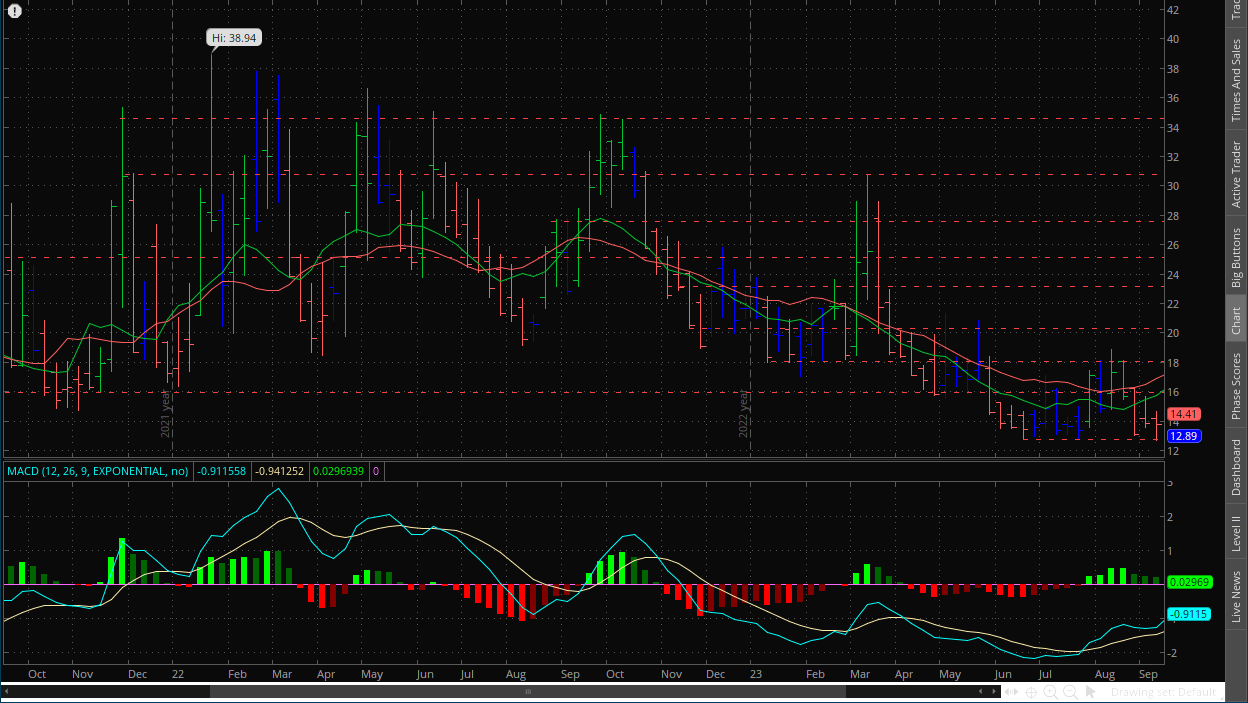
The VIX opened the week at $14.17, and worked to a high of $14.68 early on in the week. Prices found a low of 12.68 before closing the week at $13.79 following Friday's rally. Strength moved in favor of the VIX bears for the third straight week while inertia edged slightly more towards the downside.
Prices rejected a breakout below the $13 level for the second time in the last three weeks. The VIX bears are struggling to push prices below this point and have lost the momentum they had after the first initial drop a few weeks ago. Since then, they've been stagnant. More consolidation may be in store, but based on the signals we're interpreting on the daily chart along with the triple divergence signal in the MACD on this weekly chart, the VIX bulls are likely looking at an opportunity to takeover sooner rather than later.
Daily Chart:
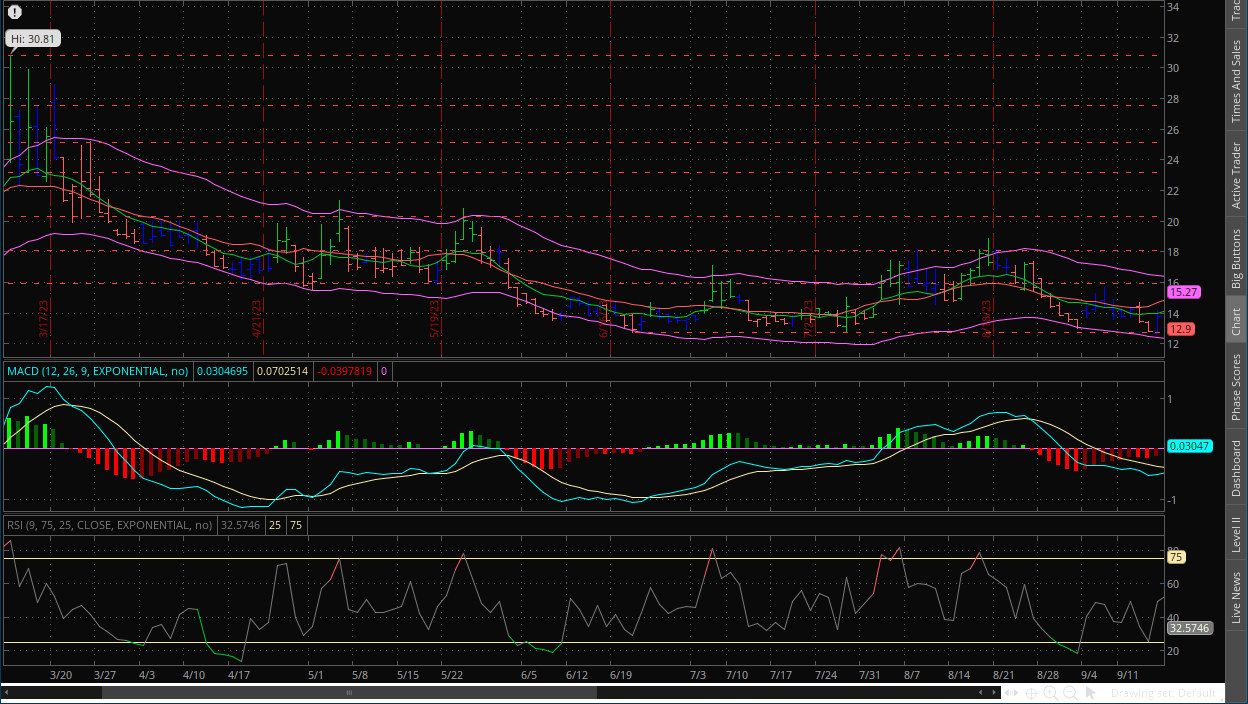
Strength moved in favor of the VIX bulls in Friday's session as they continue their bid to bring the indicator back above the centerline to start a new cycle. The solid bounce off of the $13 support level combined with a long stretch of the MACD below the centerline as well as a potential incoming crossover of the MACD lines show that the VIX bulls are in a prime position to move prices in their direction. We believe it's not a matter of if, but when. As for the extent of the potential rally, we believe that they will more than likely retest the $18 level given the underlying weakness in the VIX bears.
II-II
S&P 500: (SPX)
Weekly Chart:
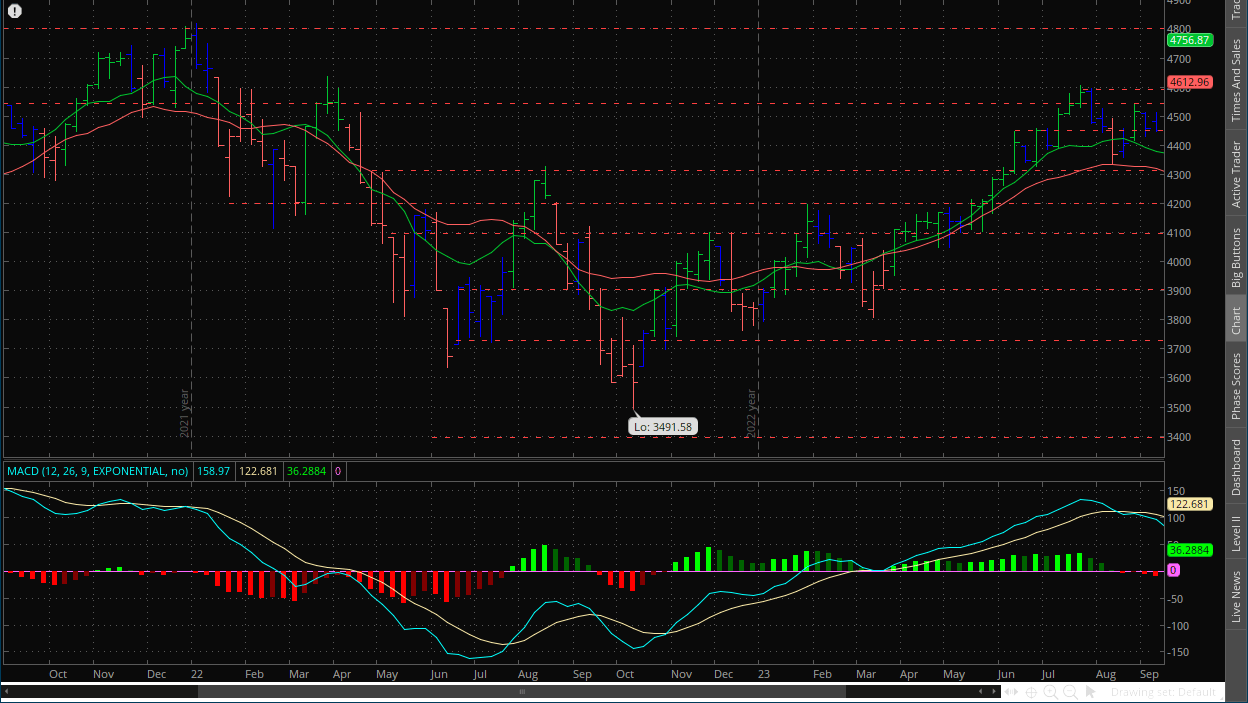
The S&P opened the week at $4,480 and found a high at $4,511. Prices would fall to a low of $4,447 at the end of the week before closing at $4,450. Strength moved in favor of the bears as they gain a little bit more momentum while inertia remained fairly flatlined. The $4,500 resistance level has rejected the bulls' attempts to breakout above it, similar to the VIX's $13 support level and the VIX bears. While the S&P's weekly chart doesn't have a triple divergence or any kind of divergence like the VIX's does, momentum is working in the bears' favor, and the VIX is acting as a sort of leading indicator for the S&P right now. So again, we will reiterate, the bears' opportunity to shift markets is fast approaching.
Daily Chart:
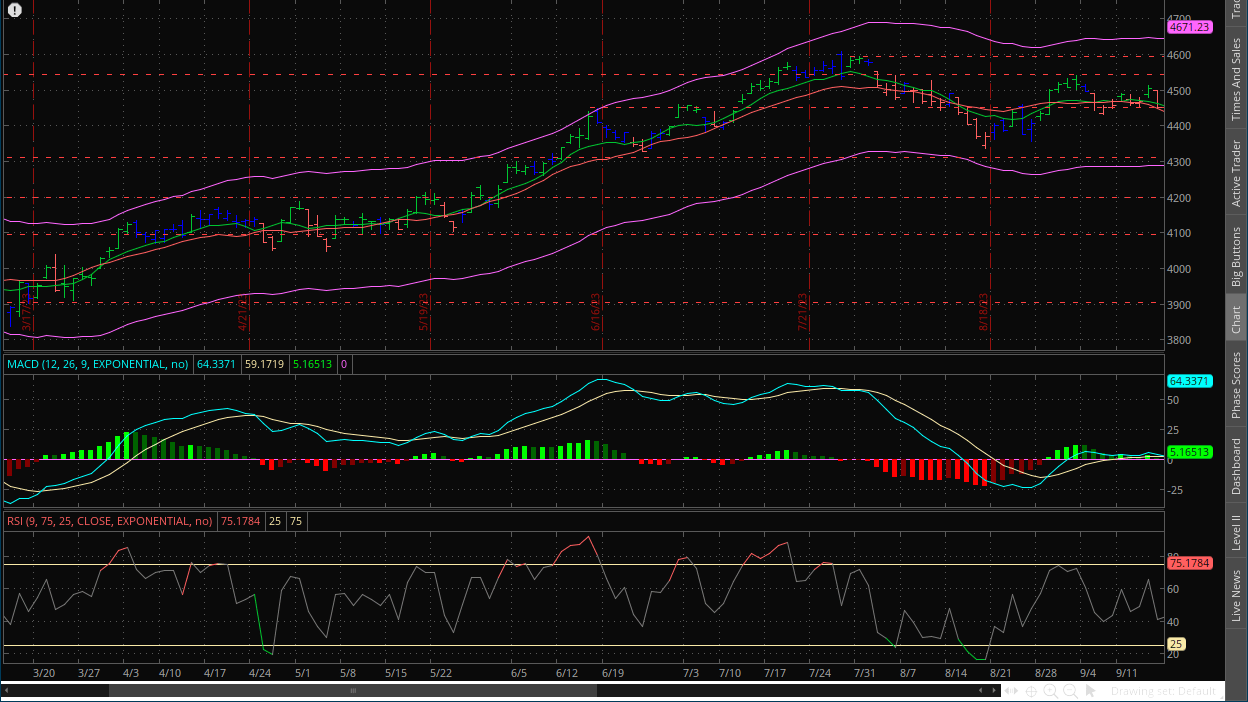
Strength moved in favor of the bears in Friday's session as they bring the indicator closer to the centerline while inertia edged more downward but remains mostly flat. With the MACD-H continuing to make a bid below the centerline, i.e. momentum is moving in that direction following the multi-month low in the indicator's previous cycle below the centerline which indicates that price action will likely continue in that direction, and a shift towards the downside is growing more and more imminent. As we've said before, the MACD Lines despite the rally back up to near highs, the latest level of them is extremely weak in comparison, showing the bulls' underlying weakness as well as indicating that this rally from the previous drop was more speculative than anything else. The latest period of consolidation has shown that the bulls have run out of gas, and the technical signals show that bears are gearing up for what could be a decent sized reversal.
Based on our formula (i.e. Technical + Fundamental = Psychological/Market Direction), the technical force is signaling that the bears' opportunity to shift the market is quickly approaching while the fundamental force is showing data that has been overly bearish in an extremely sensitive market environment. This will allow the psychological force to shift in the bears favor once the speculation frenzy is broken, which again, is likely imminent.
III
Fundamentals:
III-I
Headlines:
1.) MarketWatch: UAW strike sets stage for the 4-day workweek - and a win could take it mainstream
2.) MarketWatch: UAW strike: Auto workers set to resume talks with Ford, General Motors, Stellantis
3.) MarketWatch: US crude rises above $90 per barrel to kick off week
4.) Financial Times: Hedge fund bets could spark turmoil in US Treasuries, BIS warns
III-II
August Retail Sales Data:
Highlights:
|
Index: |
July 2023: |
August 2023: |
Wall Street Expectations: |
Take Five Expectations: |
|---|---|---|---|---|
|
Retails Sales: |
0.5%(r) |
0.6% |
0.2% |
0.3% |
|
Core Retail Sales: |
0.7%(r) |
0.6% |
0.4% |
0.4% |
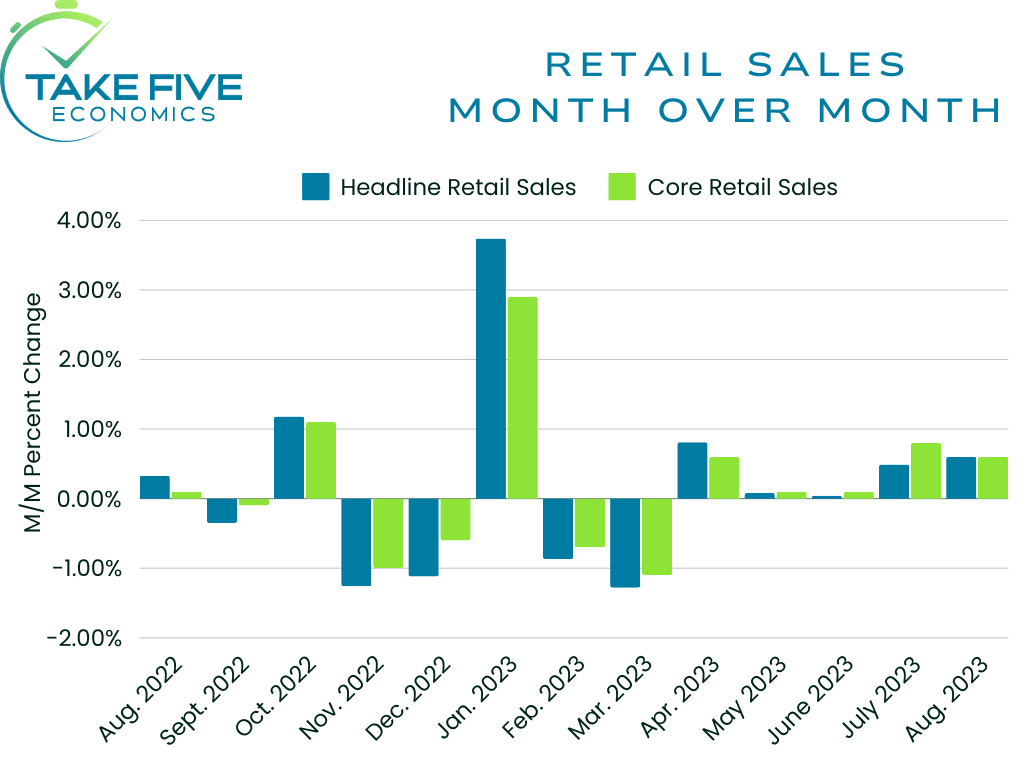
Headline Retail Sales:
August retail sales increased 0.6% month over month, beating both our own expectations and Wall Street’s by a significant margin. This followed a downwardly revised 0.5% increase last month from 0.7%.
Core Retail Sales (ex-auto):
Excluding autos, retail sales still rose by 0.6% month over month, and again beat out our own and Wall Street’s expectations. This followed a downwardly revised July figure from 1.0% to 0.7%.
Finer Details:
If gasoline station sales are removed from this report, retail sales only rose a modest 0.2%, but expectations using this measure were set at -0.1%, so another beat there. The most notable increases (besides gas stations of course; which advanced 5.2%) were clothing and clothing accessories store sales, which advanced 0.9% month over month; electronic and appliance stores at an advance of 0.7% month over month; with motor vehicle and parts dealers, general merchandise stores, and food services and drinking places all advancing 0.3% respectively. In contrast, the only notable decline was in the furniture and home furnishing index, falling by -1.0% month over month.
Putting It Together:
By looking closer into the details, consumer spending was mostly tempered as we expected in this report. Higher gas prices clearly boosted the figures, but at what point does it become inflationary? The consumer in most other areas remains tightened, but higher for longer energy prices will eventually translate to most other industries if it persists, keyword if. We don’t believe we’ve reached that point yet, but it is something we will continue to keep a close eye on, as we’ve said time and again. Hopefully we see gas prices temper. The best we can hope for is that inflation expectations do not de-anchor like they did in Europe over the summer.
III-III
August Industrial Production Data:
Highlights:
|
Index: |
July 2023: |
August 2023: |
Wall Street Expectations: |
Take Five Expectations: |
|---|---|---|---|---|
|
Industrial Production: |
0.7%(r) |
0.4% |
0.2% |
0.3% |
|
Capacity Utilization: |
79.5%(r) |
79.7% |
79.3% |
79.3% |
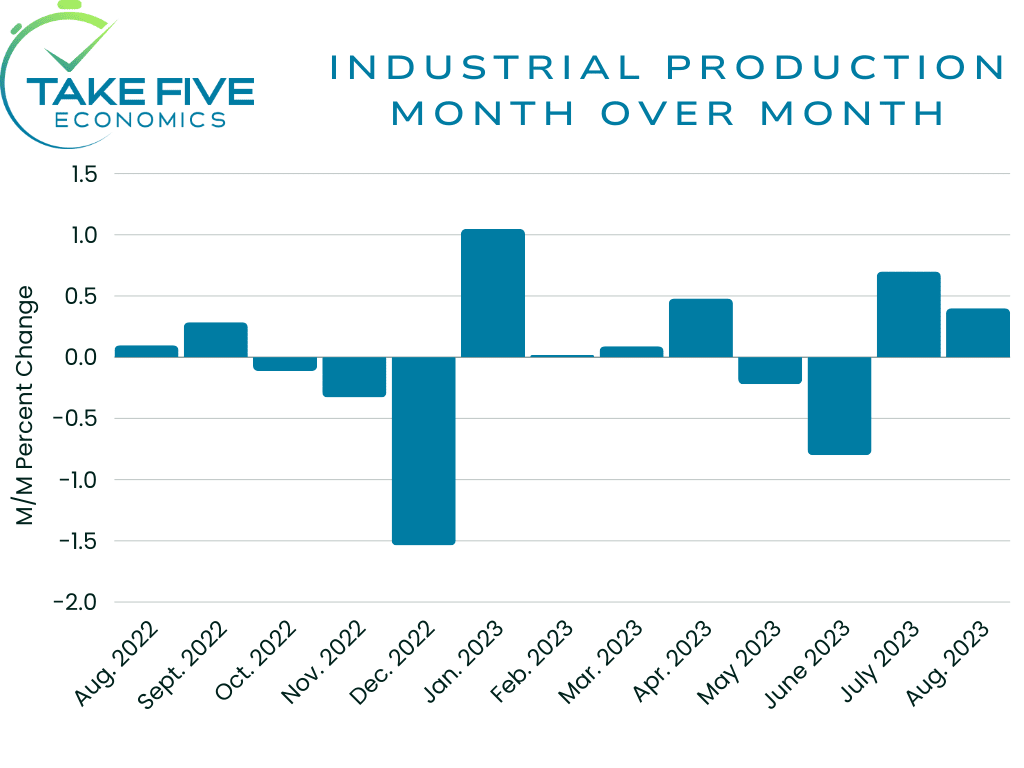
Month Over Month:
Total industrial production increased 0.4% month over month in August, slightly beating our own expectations, and followed a downwardly revised July report from 1.0% to 0.7%. Capacity utilization jumped to 79.7%, beating our expectations by a decent margin, and followed an upwardly revised July report from 79.3% to 79.5%.
Year over Year:
Total Industrial production was up 0.2% year over year, while the capacity utilization rate of 79.7% was in line with its long run average.
Finer Details:
Market Groups:
The drop in output of motor vehicles and parts (-4.8%) contributed to the declines in the index for consumer durables and transit equipment. Other than that, most major market groups posted increases in August, although most were tempered (i.e. the rate of output decreased month over month) compared to the July report. The index for materials advanced 0.7%, led by large gains in defense and space equipment as well as energy materials, which advanced 3.5% and 1.5% respectively. Production of defense and space equipment was up 10.4% year over year.
Industry Groups:
Manufacturing output rose by 0.1% month over month, but is still down -0.6% year over year. Durable manufacturing also advanced by 0.1%, with nondurable manufacturing advancing 0.2%. Within durables, gains of more than 1% were seen in primary metals (1.6%), machinery (2.0%), aerospace and misc. transportation equipment (3.3%), furniture and related products (1.3%), and misc. (1.5%). Mining output rose 1.4% and was up 3.9% year over year, but this result was largely due to a more than 3% increase in the index for oil and gas extraction. The output for utilities also rose by 0.9%.
Putting It Together:
Motor vehicle assemblies were weak in front of what is now a UAW strike. The outlook for industrial production, in at least September as this situation rambles on, will be capped because of the disruption in manufacturing capabilities and supply chains. Hopefully the strike doesn’t persist for too long however. It’s not on the scale that the teamsters strike with UPS would have been, but it will disrupt certain industries surely. Other than that, there was really nothing that was out of the ordinary in this report, besides maybe the increase in aerospace and defense production, but there could be something we’re missing with that.
III-IV
September Consumer Sentiment - Preliminary Reading:
Highlights:
|
Month: |
Sentiment: |
Present Conditions: |
Outlook: |
|---|---|---|---|
|
August 2023: |
69.5 |
75.7 |
65.5 |
|
September 2023: |
67.7 |
69.8 |
66.3 |
The preliminary reading of the University of Michigan Consumer Sentiment Index for September came in at 67.7 compared to the 69.5 final reading for August. Sentiment however is up 8.9 points compared to the same period a year ago.
Finer Details:
The current economic conditions index fell to 69.8 from 75.7 in August, while the index for consumer expectations rose to 66.3 from 65.5, meaning despite present conditions getting worse, consumers are still more optimistic about the future outlook.
One year inflation expectations fell to 3.1% from 3.5%, with five year inflation expectations also falling to 2.7% from 3.0%, coming in below the 2.9-3.1% range for only the second time in the last 26 months. Long-run inflation expectations ranged from 2.2-2.6% in the two years pre-pandemic.
Putting It Together:
The key takeaway we can pull from this report is that inflation expectations came down as we don’t want this to start de-anchoring. The reason why inflation expectations are so important is because if people are expecting and preparing for higher inflation moving forward, consumers buy more things in preparation and businesses get more inventory in bulk to receive it at a lower cost if they’re expecting higher costs in the future. But what this does is it becomes a self fulfilling prophecy; in that the increased spending/demand translates to more constrained supply chains, which then translates into inflation. Hopefully, higher gas prices moving forward don’t start to de-anchor expectations.
IV
Market Psychology & Final Thoughts:
Futures are mixed, but mostly headed down as we head towards the open as crude futures rising along with bond yields and lower overseas markets are taking their toll to kick off the week. This week will be interesting to navigate as it is a busy week for central banks. The Federal Reserve’s decision is on Wednesday, while Australia’s central bank will release its minutes for its Sept. 5 policy meeting on Tuesday. On Friday, the Bank of Japan will conclude its monetary policy meeting and traders will be looking for clarity on when the BOJ will start to shift its ultra-easy monetary policy. Elsewhere, the People’s Bank of China is also expected to release its loan prime rate decisions on Friday. We hope you found this helpful, learned a thing or two, and have a great start to the week.