The Take Five Report: 9/22/23
I
Markets:
I-I
Global Market Recap:
United States:
- S&P: -1.64%
- Dow: -1.08%
- Nasdaq: -1.82%
- Russell 2k: -1.56%
The sell off in U.S. equities would continue in today’s session, with all indexes opening substantially lower. Markets would hover near opening prices for most of the session, but a late day slide brought them even further into the red and would result in the worst day logged in September so far.
Asia:
- Shanghai: +1.55%
- Hong Kong: +2.28%
- Japan: -0.52%
- India: -0.33%
Asian markets closed mixed as the Bank of Japan left its monetary policy unchanged after its latest meeting concluded this morning, with some markets paring losses earlier in the day. BOJ Governor Kazuo Ueda has maintained that an ultra-easy monetary policy is needed until Japan sees a sustained inflation at 2%. Japan’s headline inflation figures have remained above this target since April 2022, with the latest reading coming in at 3.2% for August.
Europe:
- UK: -0.69%
- Germany: -1.33%
- France: -1.59%
- Italy: -1.78%
European markets closed lower in yesterday’s session as well following a raft of interest rate decisions from central banks in England, Turkey, Sweden, Switzerland, and Norway. The Bank of England paused its hiking cycle, keeping the policy rate at 5.25%, after cooler-than-expected inflation data. The Swedish and Norwegian central banks both opted to hike interest rates, while the Swiss National Bank paused its hiking cycle.
I-II
U.S. Sectors Snapshot:
Communication Services: -1.55%
Consumer Discretionary: -2.88%
Consumer Staples: -1.31%
Energy: -1.39%
Financials: -1.62%
Health Care: -0.92%
Industrials: -1.63%
Info Tech: -1.52%
Materials: -2.05%
Real Estate: -3.48%
Utilities: -1.08%
II
Technicals:
II-I
Volatility Index: (VIX)
Thursday Recap:
The VIX opened the session significantly higher than Wednesday’s close at $15.49. Prices would reach a low in the early premarket of $15.10, but after a brief amount of time prices skyrocketed through the rest of the session, closing the session at $17.54 which was also the high.
Daily Chart:
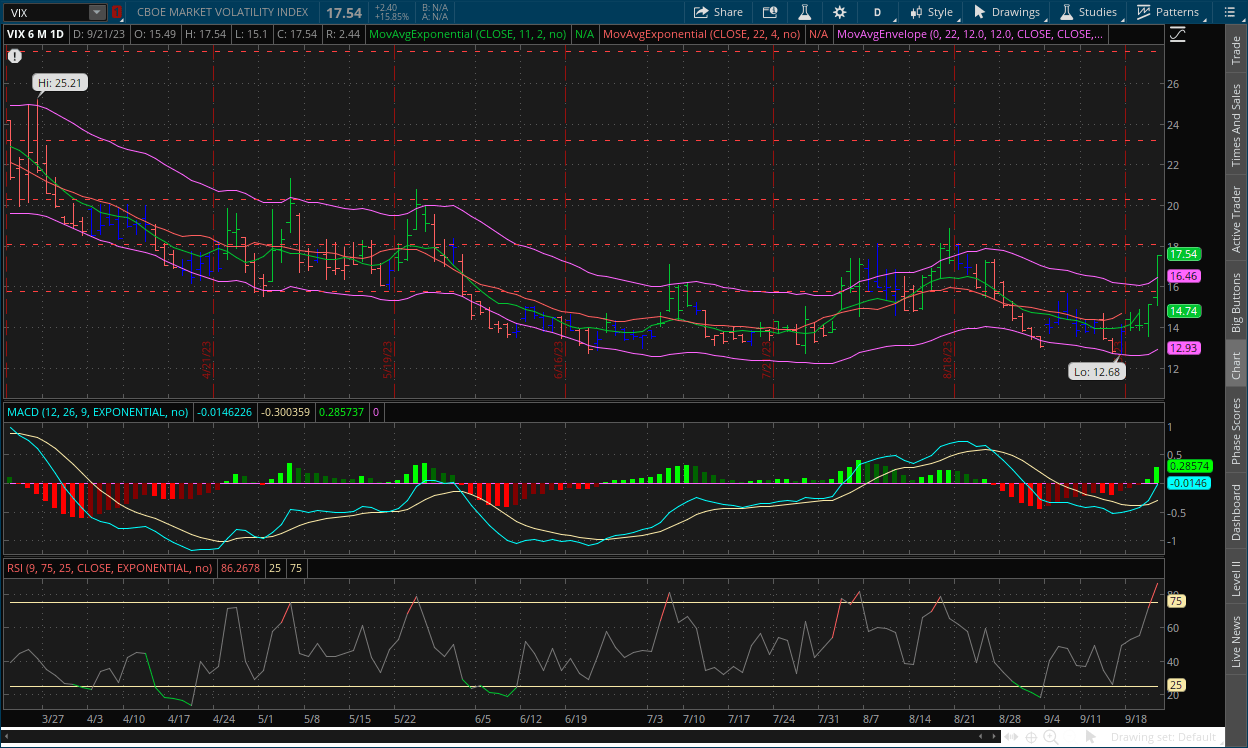
Strength would take a large step in favor of the VIX bulls and nearly jump to its previous cycle high in only its second day above the centerline following the 15.85% advance of the VIX. Inertia would also shift massively more in favor of the VIX bulls as they gain more momentum.
After the VIX’s rally in yesterday’s session, prices will likely temper today and perhaps into early next week. Rises of this extent in the VIX typically come down to earth fairly quickly. The question moving forward is will the VIX bulls be able to keep prices from returning down to its trading range, and be able to create a strong support level around $16? As we've been saying, we think yes, and that prices will likely retest the $20 level at some point.
II-II
S&P 500: (SPX)
Thursday Recap:
The S&P gapped Wednesday’s close and would open the session at $4,374, with the high only being $1 higher. Prices would slide in the second half of the session after remaining fairly flat, and wind up closing $1 off the low at $4,330, its lowest point since June 26.
Daily Chart:
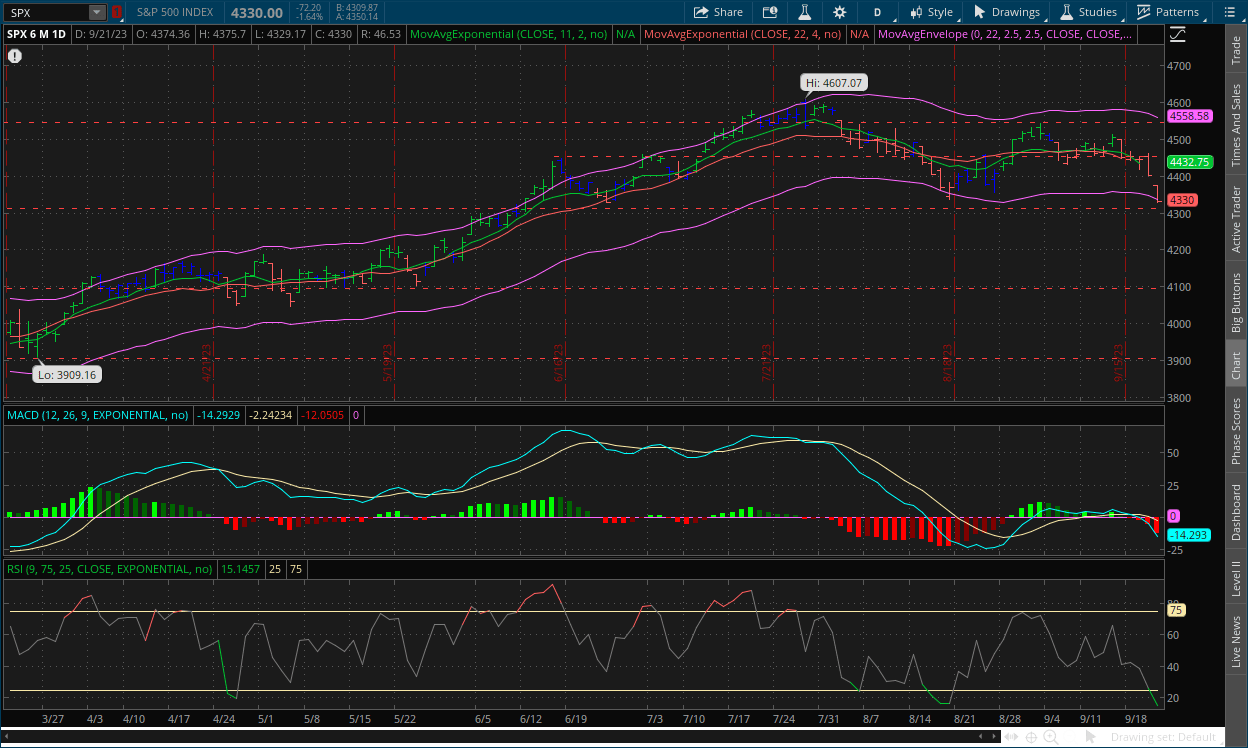
Strength jumped massively in favor with the bears, more than doubling its previous bars height following the selloff. Inertia would also shift largely more in favor of the bears as well as they gain more momentum, but there still is a lot of work to do if they want to shift it fully.
As is the case with the VIX, markets will likely pullback a little bit in today’s session and perhaps early into next week following the dive yesterday. MACD lines have created a semi bearish divergence as we've mentioned before, with their previous peak much higher than the new one with prices almost at the exact same level during those respective peaks, and the MACD-H created a multi month low, which is a fairly reliable signal that the trend will likely continue. And with momentum shifting on the weekly chart towards the bears, a new trend towards the downside has been the likely outcome for some time as the Take Five Formula has suggested.
III
Fundamentals:
III-I
Headlines:
1.) MarketWatch: US companies looking to move manufacturing from China turn to India
2.) MarketWatch: India to be added to JP Morgan’s emerging market bond index
3.) Bloomberg: Biden issues restrictions on companies getting chip funds
4.) Bloomberg: BofA says investors flee from stocks as hard landing scenario grows
5.) Financial Times: Eurozone downturn looms as business orders fall
III-II
Real Estate:
A Brief Refresher:
This is a topic that is long overdue for an update. The real estate market is one that is extremely slow to change. In our last update, we discussed how property prices were remaining elevated because of the supply and demand aspects of the market. Supply had been extremely low, and although demand was historically low, it was high when you compared it to the supply level at the time. This was causing real estate prices to remain sticky as a national average. The S&P Case Shiller Home Price Index (mouth full) fell by roughly 6% from its 2022 peak level in Q1, but the seasonal demand in the spring and early summer caused prices (as a national average) to rise back up to their previous peak.
Real estate development projects exploded in the spring and early summer as well, thus increasing the supply. But demand due to higher prices and *much* higher interest rates caused it to temper late into the summer and now the early fall. The home price index is on a three-month lag, and the latest figures again (i.e. June) have shown prices return to their previous peak. But as we just said, demand had begun to slow into the late summer and early fall, which has been shown in leading indicators, e.g. new mortgage applications, existing home sales, etc. What we needed to see for prices to come down was a.) a large increase in supply (homes for sale) that would return supply to at least historically normal levels, and b.) demand to temper. We’ve had tempering in demand, and now it seems like supply is slowly starting to increase.
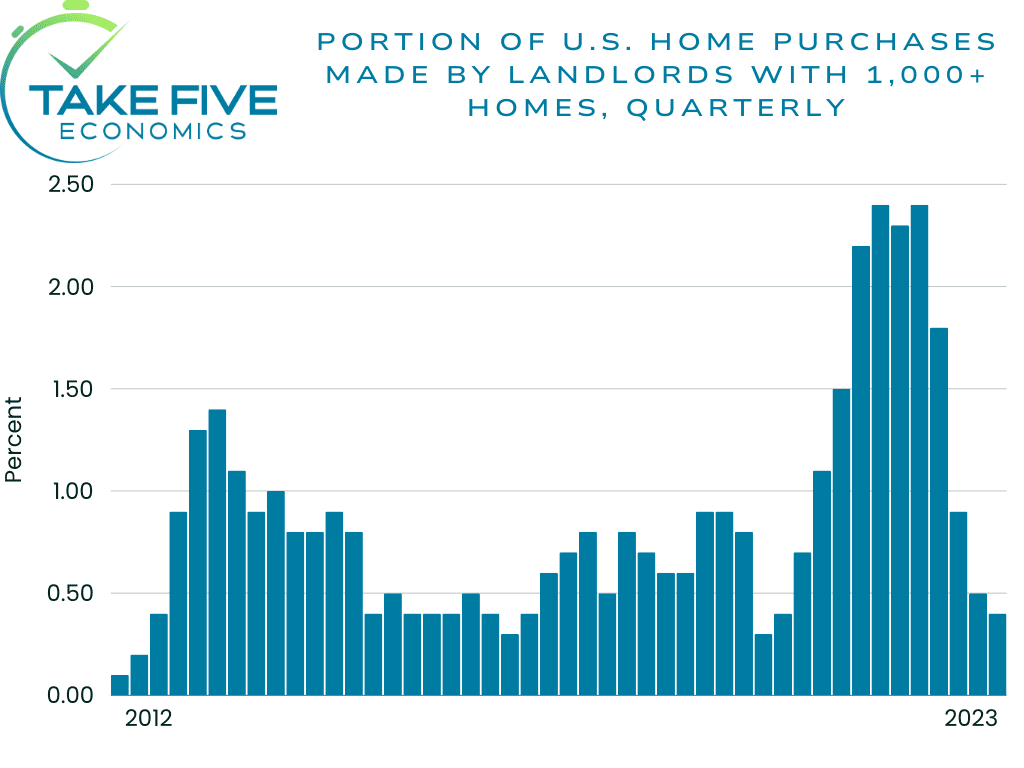
Net Sellers:
Higher borrowing costs and the shortage of properties have slowed home buying from Wall Street’s real estate giants, limiting their ability to grow at the same time rents are climbing. Financing has become extremely expensive, and competition is harsh from the people who are willing to pay a premium for the few homes that are actually hitting the market. Prices have pushed past what some companies like AMH and Invitation Homes can pay or are willing to pay and still meet profit targets.
The shares of both of the respective companies mentioned above have soared so far in 2023, with AMH outpacing the S&P 500 and Invitation Homes moving along with it. But, this may start to turn if the firms are unable to add to their financial statements. The CEO of Invitation Homes told investors, “We write hundreds of offers every week at price points we’d be willing to transact at, but we’re striking out a lot.” Landlords with 1,000 properties or more accounted for only 0.4% of purchases during Q2, largely down from its 2022 peak of 2.4% in late 2021.
This is a sign that the Federal Reserve is close to the effective terminal rate that’s needed to shift the housing market down from overdrive. Invitation Homes has been selling properties that have appreciated to the point that they’re yielding less than 4%, and putting the cash into money market funds that are yielding more than 5% on their deposits.
This is one of the many reasons why money markets are so hot right now as well. It's allowing real estate owners who are unloading inventory with low yields to park their freed-up capital, receive a higher yield, and be able to withdraw it at any time.
Executives say they’re building up cash to spend on pools of homes that are offered by motivated sellers. In July, the company bought 1,870 houses at $645 million from Starwood Real Estate Income Trust (REIT), a company that is now nearly bankrupt due to excessive housing market speculation (sound familiar?), at a discount rate from what they originally paid for them in the 2021 buying frenzy, according to SEC filings.
Before that purchase, Invitation only added 470 houses in 2023, mostly from developers, as purchases of newer homes helps minimize downside risk. But in addition, they sold 675 in the first half of the year, meaning they were net sellers of -205 homes if it weren’t for the Starwood acquisition, and executives said they expect to be even more aggressive sellers in the second half.
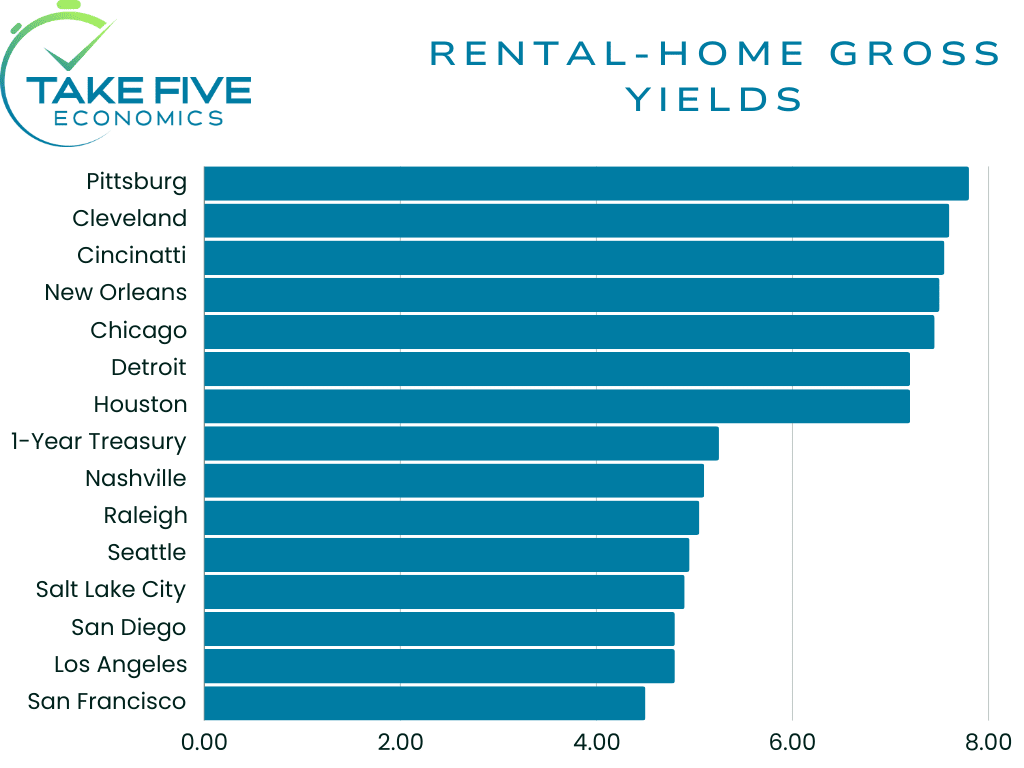
AMH, owner of 59,000 houses, was also a net seller in the first half of the year, selling 1,100 homes while adding 780 in which again, were mostly newly developed properties in high yield areas. These areas (see chart) have higher yields because they’re technically riskier assets (as we’ve discussed in our bond market analysis), e.g. higher risk of eviction, property damage etc. So, their strategy has been to buy lower quality homes in higher risk areas for the yield but try to offset that risk by purchasing newly developed properties.
AMH is planning to build more than 2,200 properties in 2023 and has purchased land to add 13,000 more down the line, as yields are now greater with property development used for renting than those the company just flat-out buy’s because lumber prices have fallen from their 2020-2021 surge, CEO David Singelyn said last week.
When institutions are starting to sell and can’t find properties at a reasonable purchasing price, that is the hallmark sign that a potential flip in the housing market is approaching. In our last real estate market overview at the end of April, we said that once institutions start to flip it will create a spiral. With mortgage rates knocking on the door of 8% following the FOMC meeting on Wednesday where they indicated they intend to keep rates where they are for as long as they see fit, and with institutions now starting to flip, there is fear starting to spread within the real estate market.
With hopes of a Fed pivot coming in the next few months dwindling and now that the idea is *finally* starting to stick, we could start to see more turmoil unfold within the real estate market as higher for longer means more potential for something to break, causing a domino effect.
As for the extent, it’s still a guessing game, and the domino effect that is created could be minimal, or it could be terminal. At this point, it’s hard to tell whether or not this is the big one, the big cycle ending bust, or if it’s another small cycle bust before the big one, which we believe will happen within the next ten years (give or take) regardless.
IV
Market Psychology & Final Thoughts:
Futures are edging up as we head towards the open. European markets are edging down however, while bond yields are mixed, and crude is rallying once again. Today will likely be tempered, and rather mixed overall based on premarket movements. As we've said before, the technical force has been trending more and more bearish for a while now, with the fundamental force also moving further in that direction. When those two forces are moving in the same direction, you'll see a shift in the mental state of the market sooner or later, it's just uptrends are much harder to break than downtrends. The signals we've seen have indicated that there is a big shift coming as we’ve been saying would be the case for a long time now, and even more specifically as we move into Q3. As always, we hope you found this helpful, learned a thing or two about the real estate market, and have a stupendous weekend.