The Take Five Report: 9/27/23
I
Markets:
I-I
Global Market Recap:
United States:
- S&P: -1.49%
- Dow: -1.20%
- Nasdaq: -1.55%
- Russell 2k: -1.27%
U.S. indexes opened in the red, and would continue declining throughout the session and through the close following premarket volatility. The consumer confidence and new home sales reports weren’t much help for the bulls either, as you’ll see below.
Asia:
- Shanghai: +0.16%
- Hong Kong: +0.83%
- Japan: +0.18%
- India: +0.26%
Asian markets reversed earlier losses to finish marginally higher in this morning’s session as participants divested China’s industrial data and Australian inflation. Australia’s weighted inflation rate climbed 5.2% year on year in August, in line with expectations from economists polled by Reuters, while headline inflation came in at 5.5% China’s industrial sector fell 11.7% y/y in the first eight months of 2023, compared with a larger 15.5% contraction in the first seven months of the year, a sign that recent support measures may be helping to stabilize the economy.
Europe:
- UK: +0.02%
- Germany: -0.97%
- France: -0.70%
- Italy: -1.00%
European markets fell for the fourth straight session as poor sentiment and outlook continue to weigh on global markets. German bond yields rose to their highest level since 2011, the region is now looking ahead to eurozone inflation data slated to release on Friday.
I-II
U.S. Sectors Snapshot:
- Communication Services: -1.34%
- Consumer Discretionary: -2.03%
- Consumer Staples: -0.90%
- Energy: -0.50%
- Financials: -1.34%
- Health Care: -0.86%
- Industrials: -1.52%
- Info Tech: -1.78%
- Materials: -1.45%
- Real Estate: -1.78%
- Utilities: -3.05%
II
Technicals:
II-I
Volatility Index: (VIX)
Tuesday Recap:
The VIX opened the session much higher than Monday’s close at $18.03 as an overnight selloff jumped the gap. Prices declined to a low of $17.17 early on but would later rally through the majority of the day and reach a high of $19.50 before closing at $18.94.
Daily Chart:
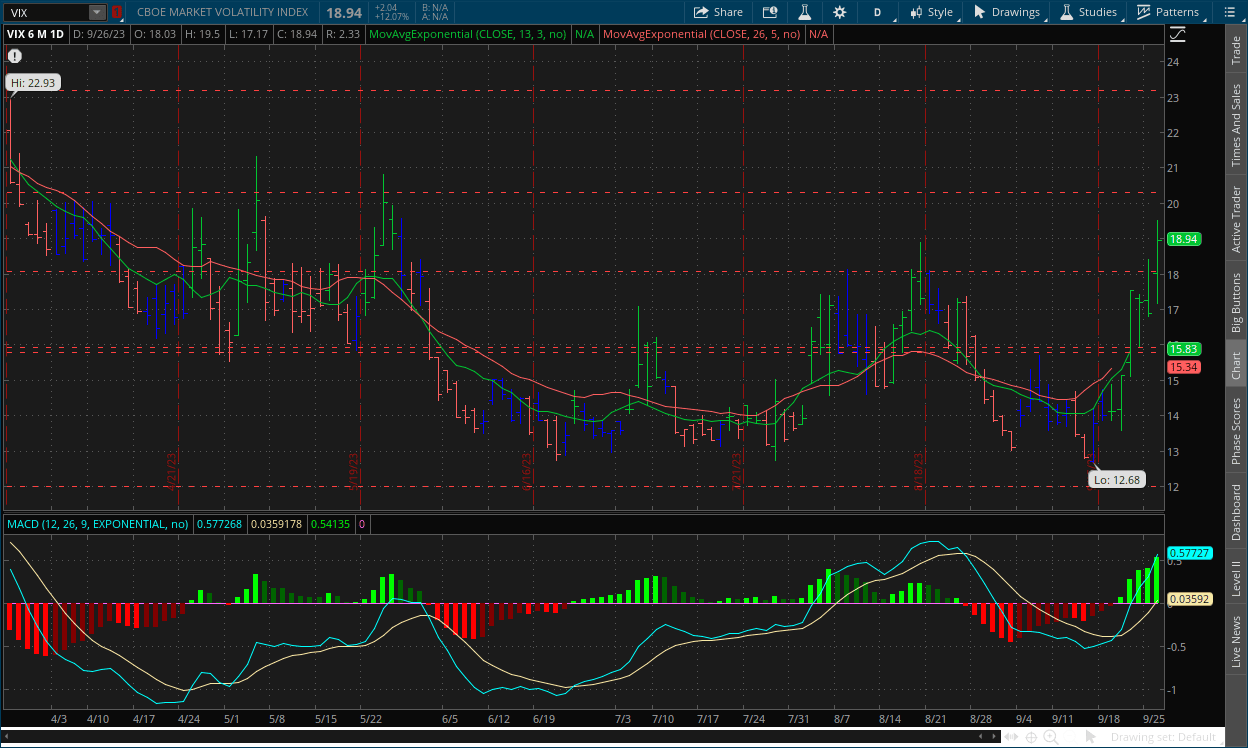
Strength would strongly move in favor of the VIX bulls, and reach an overwhelming multi month high in this latest push while inertia continues to shift heavily back towards the upside.
The VIX bulls made an impressive push in yesterday’s session, shattering the $18 resistance level and reaching a high of $19.50, its highest level since May 26. This is without a doubt a true breakout above $16 at this point. Expect prices to have a lot of back-and-forth movement, but the VIX will likely start trending in this direction for the time being. Once prices ultimately calm down, the key for the VIX bulls will be keeping them either above $16 or $18.
II-II
S&P 500: (SPX)
Tuesday Recap:
The S&P opened the day lower at $4,312, with the high being less than $1 above that mark. Prices slid throughout the day, reaching a low of $4,265 before closing at $4,273.
Daily Chart:
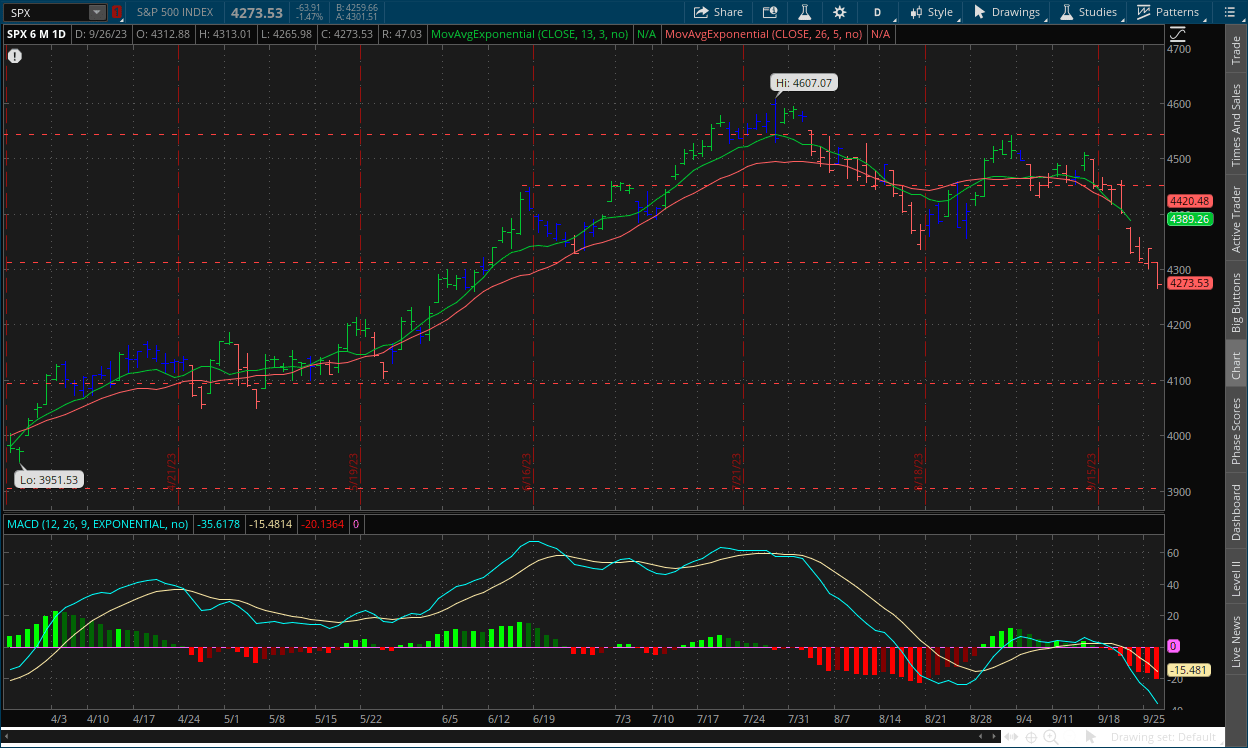
Strength would move strongly in favor of the bears after tempering over the last two sessions, and is nearly at an even lower multi month low that was set in the previous cycle below the centerline. Inertia continued to shift more bearish as prices continued their cliff jump.
The bears shattered the $4,300 support level in yesterday’s session as fear begins to grip markets even more. The key for bears is to keep prices below this level, but even if the bulls do retake it, we don’t think the trend reverses back to previous highs for some time. There are many catalysts on the road ahead that could panic markets, e.g. government shutdown even though it shouldn’t, PCE later this week, UAW, GDP, etc. As for today, there’s not much in the way, so we may see prices relax a bit.
III
Fundamentals:
III-I
Headlines:
1.) MarketWatch: The stock market can’t catch a break. Good news is bad news, and now bad news is bad news too
2.) Bloomberg: UBS, Credit Suisse face growing probe over alleged Russian sanctions evasion
3.) Wall Street Journal: Rising loan costs are hurting riskier companies
4.) Financial Times: European and Asian stocks rise on improved China industrial data
III-II
Consumer Confidence Final Reading for September:
Highlights:
|
Index: |
August 2023: |
September 2023: |
Wall Street Expectations: |
Take Five Expectations: |
|---|---|---|---|---|
|
Consumer Confidence: |
108.7(r) |
103.0 |
105.0 |
100 |
The consumer confidence index dropped to 103.0 in September, beating our own expectations and coming in below Wall Street’s. The August report was revised up from 106.1 to 108.7.
The present situation index rose to 147.1 this month compared to 146.7 in the prior report, which was surprising but again we're not sure how much the previous week had been taken into account. However, the future expectations index fell from 83.3 in August to 73.7 this month.
Putting It Together:
When future expectations fall below 80.0, it historically signals a recession within the next year. This was where it was stuck for so long, but over the last few months the index broke back above it fairly strongly. The double dip is concerning, as many economic data sets will usually dip below their “recession mark”, and the double dip is usually the signal. The positive takeaway from this is that 1 year inflation expectations stayed the same at 5.7%, and they're not de-anchoring.
III-III
New Home Sales for August:
Highlights:
|
Index: |
July 2023: |
August 2023: |
Wall Street Expectations: |
Take Five Expectations: |
|---|---|---|---|---|
|
New Home Sales: |
739k(r) |
675k |
695k |
680k |
New home sales declined -8.7% month over month in August to 675,000 units from an upwardly revised 739,000 from 714,000 in July. This beat our own expectations only slightly, and came in well below Wall Street’s. Year over year, the index was still up 5.8%.
Finer Details:
Averages:
The median sales price declined -2.3% year over year to $430,300 while the average sales price declined -3.2% to 514,000. At the current pace, the supply of new homes for sale stood at 7.8 months compared to 7.0 in July, and 8.7 months in August of last year, showing people are finding it harder to sell.
What’s Being Bought:
The percentage of new homes sold for $399,999 or less accounted for 40% of new homes sold in this report compared to 38% in July, and 39% one year ago. Homes priced between $400,000 and $749,000 accounted for 45% of new homes sold compared to 52% in July. New homes priced at $750,000 or over accounted for 15% of sales in August versus 10% in July.
Regional Data:
|
% Change: |
Northeast: |
Midwest: |
South: |
West: |
|---|---|---|---|---|
|
M/M: |
+6.7% |
-17.2% |
-7.5% |
-9.4% |
|
Y/Y: |
+18.5% |
+24.2% |
-9.2% |
+44.1% |
New home sales are counted at the signing of a contract, making them a leading indicator of the housing market. They can be volatile however on a month over month basis. Though new home sales remain supported by a lack of previously owned homes on the market, i.e. most new home sales are from new developments, the surge in mortgage rates is reducing the affordability for them.
The 30-year fixed mortgage jumped to nearly 7.5% last week, their highest mark since 2001, and are rising in lockstep with U.S. treasury yields which we expect to continue rising for the time being. The amount of prospective home buyers is drying up (i.e. demand), as was seen in the National Association of Home Builders Index, as it dropped in September below the breakeven level of 50, with the survey’s measure of prospective home buyers falling to the lowest level since February. New home sales are a leading indicator of demand. What were the two things in Friday’s report that we said needed to happen for the housing market to flip? A.) an increase in the supply of homes for sale, and B.) demand to temper, i.e. the number of prospective buyers to fall relative to the total homes for sale. Institutions are starting to dump inventory, and normal people can’t afford homes at these rates, meaning the supply is increasing, and demand is decreasing. As sellers run out of buyers, prices will continue to fall, until something breaks. Higher for longer.
IV
Market Psychology & Final Thoughts:
Market futures are moving upwards as we head towards the open. But European markets are becoming mixed as their session rolls on, with crude oil at $92.02, up $1.64 so far today as they pullback from the previous dip. Yields are down this morning however, so today’s landscape is a little murky.
There isn’t much in the way of catalysts today that we can see, but whether the market finishes up or down, expect prices to relax. Today the durable orders and goods report will be released, along with the weekly crude oil inventories. These will have smaller effects on markets, but they’ll affect them nonetheless. As always, we hope you found this to be helpful, you perhaps learned one thing, maybe two, and have a wicked good Wednesday.