The Take Five Report: 10/2/23
I
Markets:
I-I
Global Market Recap:
United States:
- S&P: -0.27%
- Dow: -0.47%
- Nasdaq: +0.14%
- Russell 2k: -0.51%
U.S. stocks opened Friday’s session on a positive note. However, it wouldn’t last too long for the S&P, Dow, and Russell 2000 as prices would start declining fairly quickly, and continue that trend through the close. The Nasdaq opened substantially higher compared to the others. The index would follow a similar price pattern throughout the session, but a bounce at the breakeven mark at the end of the day allowed the tech heavy index to close with marginal gains.
Asia:
- Shanghai: closed
- Hong Kong: closed
- Japan: -0.31%
- India: +0.49%
Asian markets fell following the release of Chinese manufacturing data that showed factory activity expanding for the first time since April. China’s PMI climbed to 50.2 in September from 49.7, beating expectations. Sentiment of Japan’s biggest manufacturers also improved.
Europe:
- UK: +0.08%
- Germany: +0.41%
- France: +0.26%
- Italy: +0.28%
European stocks closed mostly higher on Friday, but the last few sessions capped off a very weak month for the region, and the worst quarter in the last year. Eurozone inflation fell to 4.3% year over year in September, and was in line with Germany’s figure of 4.3% the day prior.
I-II
U.S. Sectors Snapshot:
- Communication Services: -0.73%
- Consumer Discretionary: +0.53%
- Consumer Staples: -0.25%
- Energy: -1.97%
- Financials: -0.88%
- Health Care: -0.77%
- Industrials: -0.59%
- Info Tech: +0.39%
- Materials: -0.22%
- Real Estate: +0.35%
- Utilities: +0.21%
II
Technicals:
II-I
Volatility Index: (VIX)
Weekly Chart:
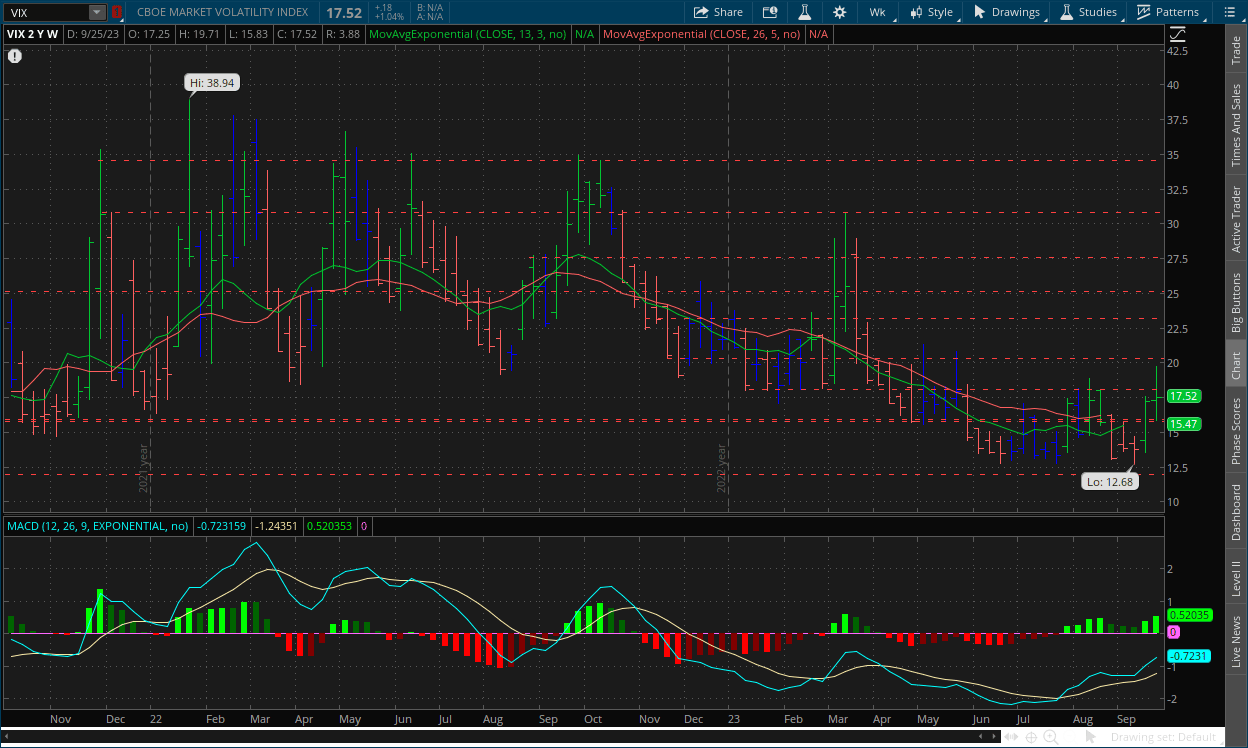
The VIX opened the week slightly above the previous at $17.25. Prices jumped to a high of $19.71, the highest point in 18 weeks, in the first few days, but would later slide to a low of $15.83 before rallying back to close just above the week’s opening price at $17.52.
Strength made a good jump in favor of the VIX bulls on the weekly chart as they continue to gain more control over volatility moving forward. Inertia continued to shift in favor of the VIX bulls on the front end, but again they still have a lot of work to do on the back end if they hope to truly shift momentum.
Daily Chart:
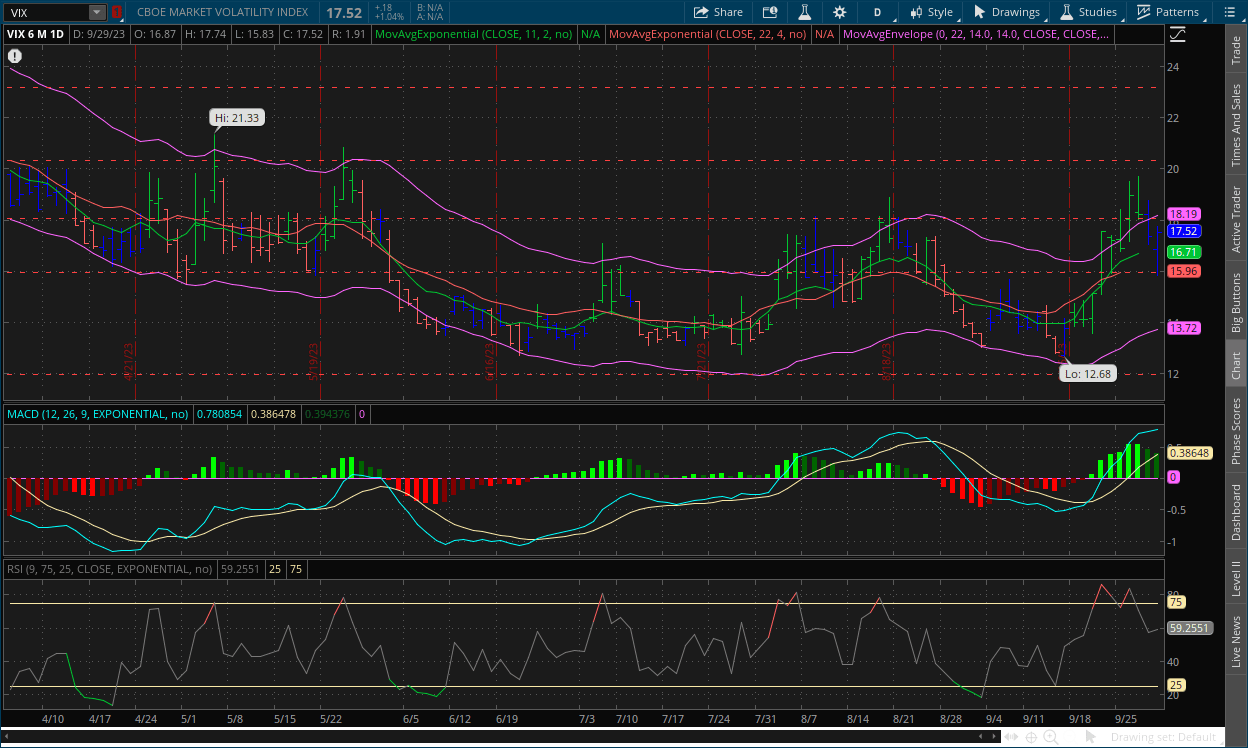
Prices may have finished on a positive note on Friday, but the strong push in the early premarket by the VIX bears was enough to move strength in favor of them by a decent margin. Inertia however continued to shift upwards, although there was some slight tempering as it catches up to prices.
As we said in Friday's report, "What we may see is a decline back to $16, and consolidation around that point. It’s hard to say (especially for the VIX) if prices will keep trending upwards in the shorter term, as its rises are extremely sharp, followed by more steady declines in comparison. But if the VIX bulls can manage to keep prices above $16, expect the next jump to surpass this latest peak." This is what we ultimately saw in Friday's session, and prices rebounded from the $16 support level to close back above $17.50. The downward momentum of the MACD (strength) is taking prices along with it. But there is a likely possibility that prices will begin to consolidate before making their next move, which will also allow for the MACD-H to return to the centerline and not continue at highly elevated levels.
II-II
S&P 500: (SPX)
Weekly Chart:
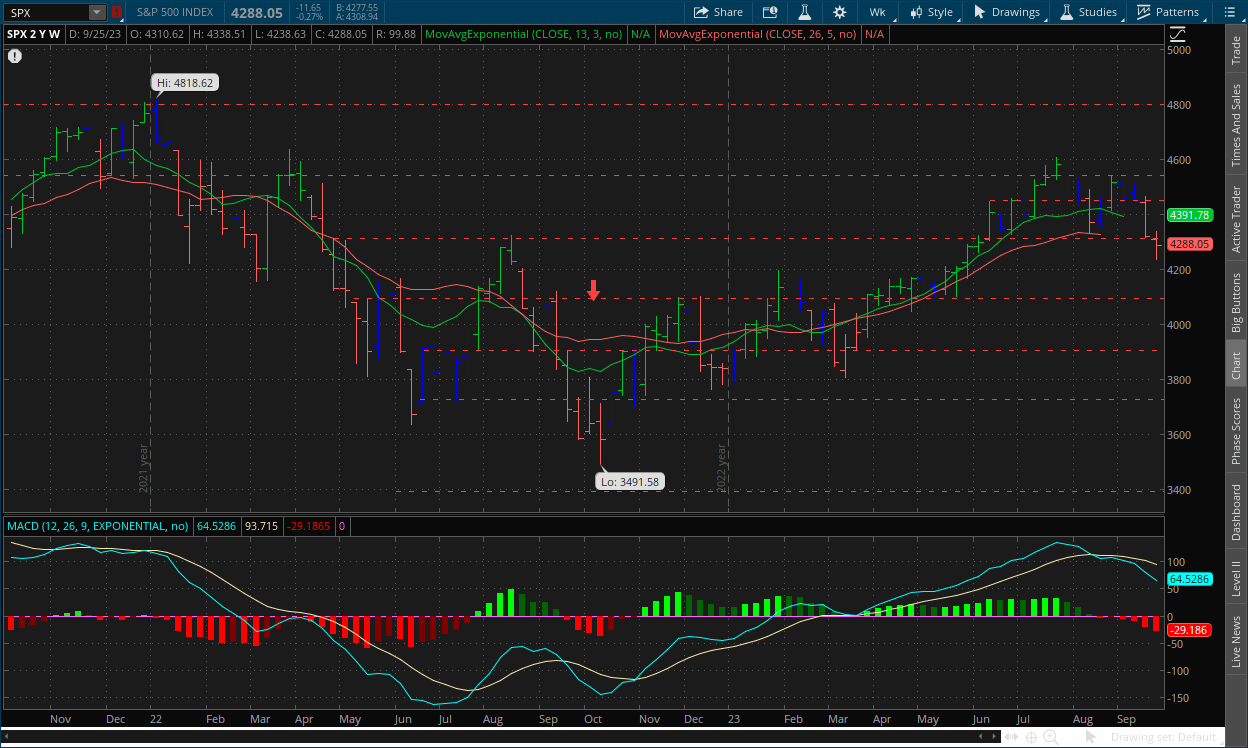
The S&P opened slightly lower than the previous week at $4,310. Prices worked to a high of $4,338, and fell to a low of $4,238, and ultimately closed the week lower at $4,288, its lowest closing mark since the week of June 5.
Strength moved in favor of the bears this week as they continued to push prices lower while inertia kept shifting more to the downside on the front end, but they still need to put in significantly more work in order to truly shift it. The break below the $4,300 level is a significant step for the bears as it is a more major point of support. After a break below this type of level, prices will typically consolidate before making their next move, which we can then figure out what that move will likely be based on the technical signals and indicators. The MACD-H has a lot of room to the downside to work with, and momentum is working in favor of the bears on this longer-term view of the index. Even if prices do consolidate or even slightly rally back above $4,300, momentum is still moving towards the downside.
Daily Chart:
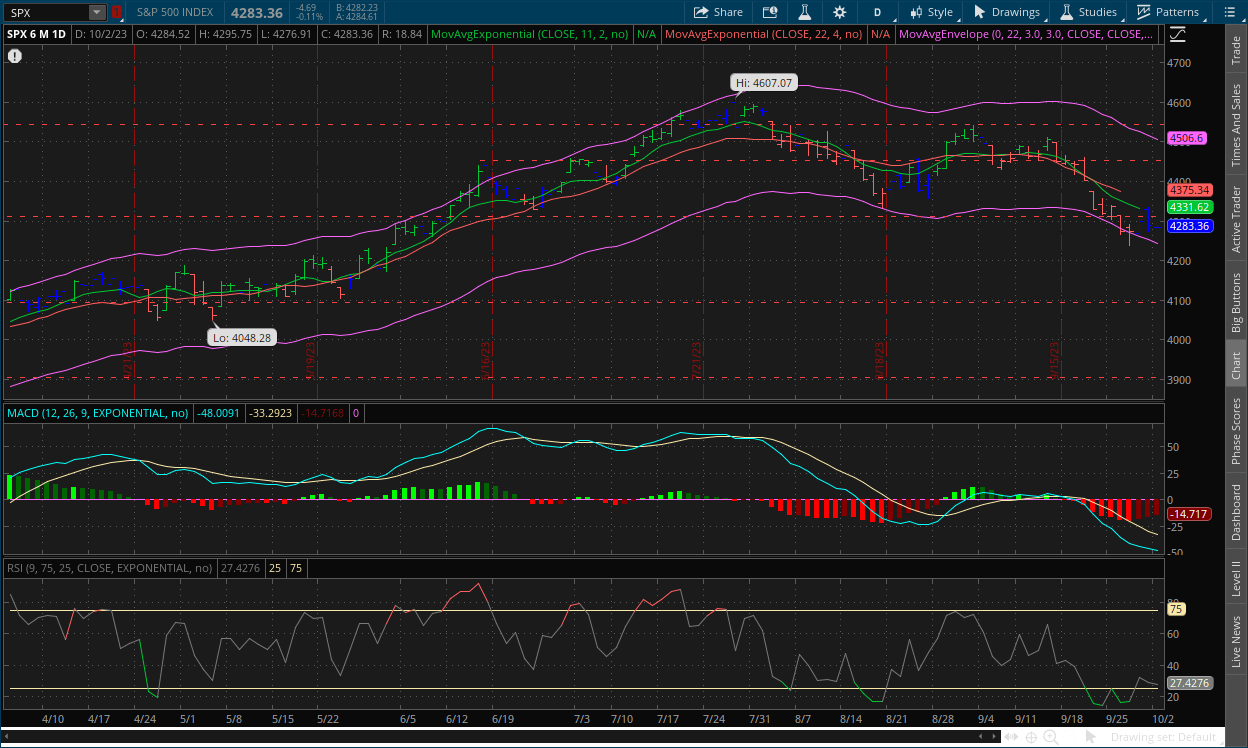
Strength moved in favor of the bulls in Friday’s session as prices began to flatten beneath the $4,300 level while inertia continues to shift towards the downside. Prices look to be entering some form of consolidation as market participants gear up for important labor market data later in the week. Before a big piece of news comes out that is critical to the fundamental force's direction, markets will typically consolidate and flatline. Then, they'll use the shorter-term catalyst whether it be bullish or bearish to push in that direction as more big money floods the markets as well, playing off the piece of news. Retail traders don't have the numbers or the capital to make the S&P trend, but institutions do. The monthly fundamental data that's released are only numbers in the equation of figuring out where the markets will be headed over the long term, but each release can be used to figure out where they will be headed in the short-term and again, as of right now, that is to the downside and the technical force lines up with that as well.
III
Fundamentals:
III-I
Headlines:
1.) MarketWatch: UAW Strike: Union reaches deal with Volvo’s Mack trucks
2.) MarketWatch: Treasury yields jump as Washington averts shutdown
3.) Bloomberg: Tesla deliveries slide as factory closures slow production
4.) Wall Street Journal: Matt Gaetz plans to vote to oust Kevin McCarthy after speaker avoids shutdown
- T5 note: We’ll go over the shutdown situation tomorrow
5.) Financial Times: Trade in ‘fear gauge’ at high as inventors hedge amid fragile markets
III-II
The Yield Curve is Steepening Part 2 - Historical Context & Bond Market Outlook:
Background:
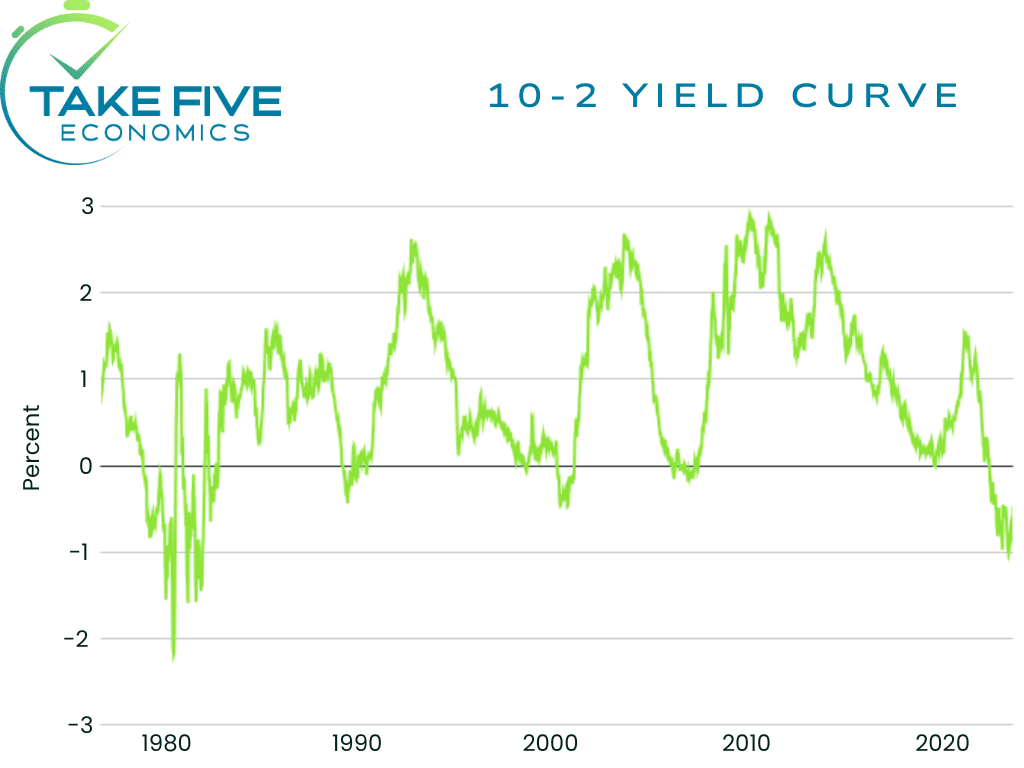
Since it is October 2 (10/2), it seems fitting that we discuss the history of the inverted yield curve signal between the 10- and 2-year treasuries. The 10-2 inverted yield curve has happened throughout history and has preceded every great recession the U.S. has had, and many use it as a warning signal that tougher times are likely ahead. The true pain however has never come from the inversion itself, only warning signs (e.g. Bear Stearns in 2008, SVB in 2023). The true pain comes from the steepening, which is when the yield curve un-inverts and goes back to normal. In Friday’s report, we discussed the difference between bear steepening and bull steepening. If you need a refresher you can go back and look through section III-II of that report.
The chart below shows all of the inversions of the 10-2 spread since 1980. Notice how the dips below the zero line precede every recession (shaded areas), and the steepening occurs as the economy goes into one.
Early 1980's:
Yield Curve:
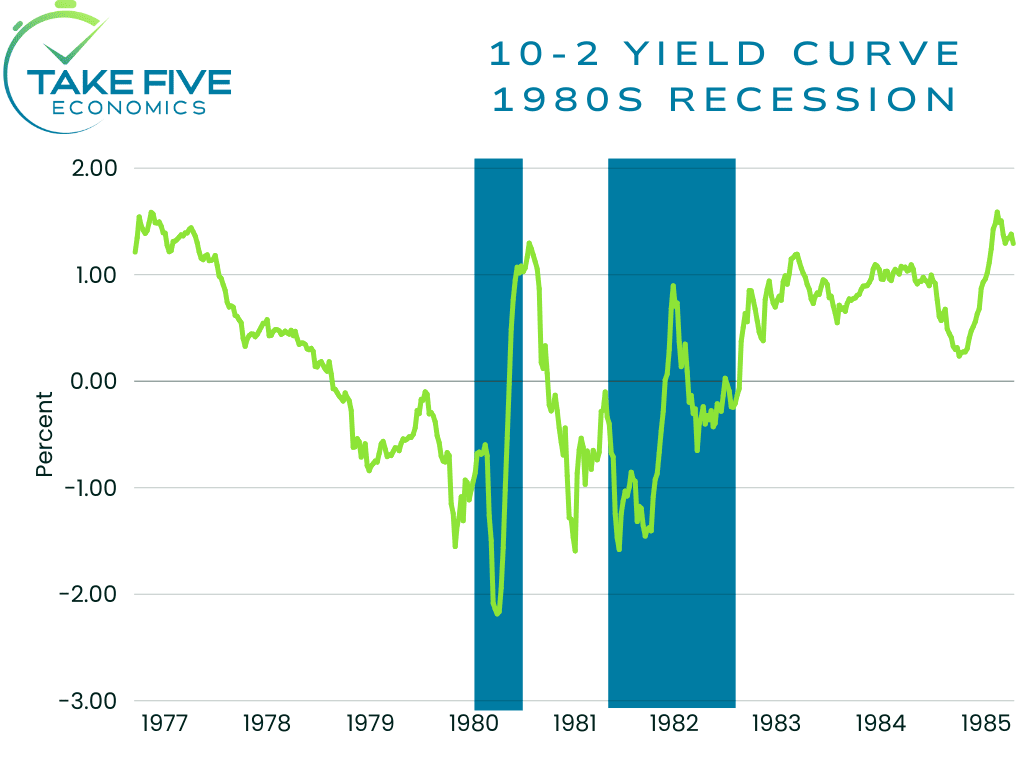
The early 80’s was the worst inflationary environment that the U.S. ever experienced, and the lack of experience by the Federal Reserve led to multiple recessions through the 1970’s and early 1980’s. This caused the Volker era in the Fed, who put his foot on the neck of the economy by raising rates to 20%. As the yield curve began to steepen, the economy took a turn and went into a recession. The outlier of the early 80’s was that the yield curve steepened while the U.S. was already in a recession, but the inversion was still the precursor of it. This was an example of a bear steepening, and to this day it is the largest spread the 10-year and 2-year treasuries have ever had.
Stock Market:
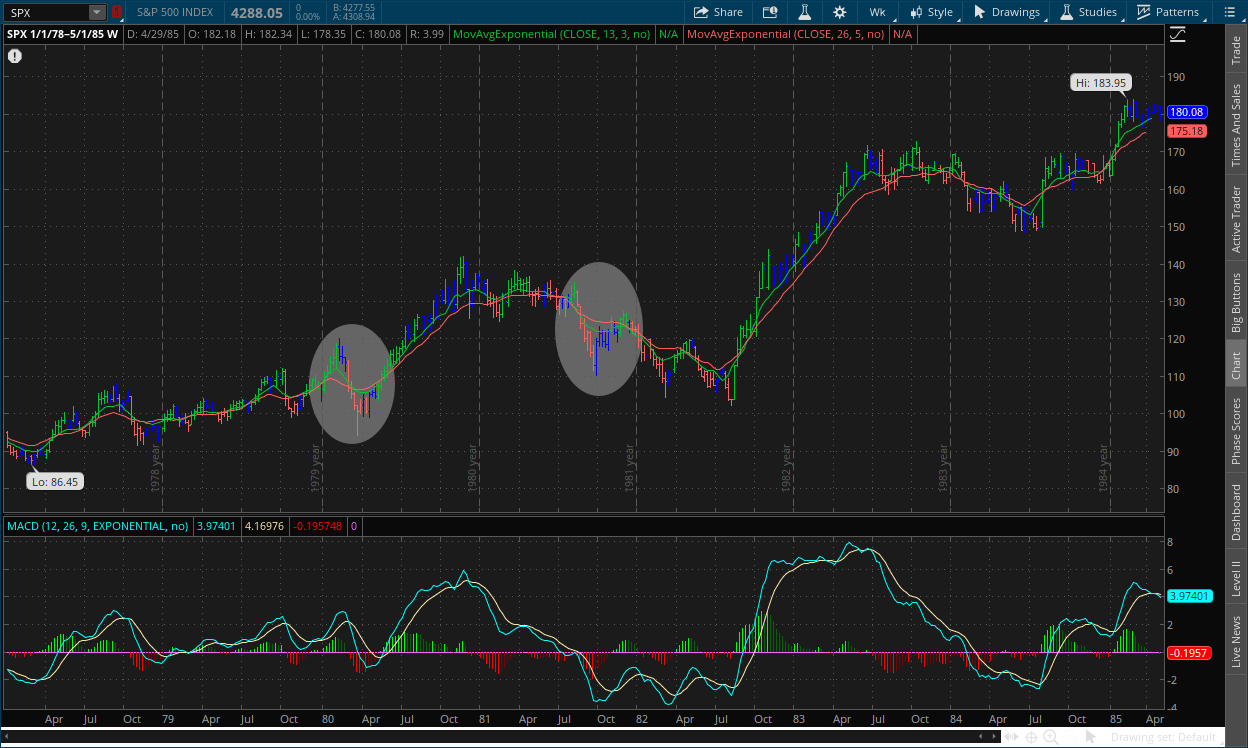
The yield curve steepened over the zero line in May of 1980 and May of 1981 (highlighted by the ovals) when the U.S. was already considered to be in a recession. But the yield curve bottom was during times where the market was at high points, i.e. times of euphoria (at least in the stock market).
Early 1990's:
Yield Curve:
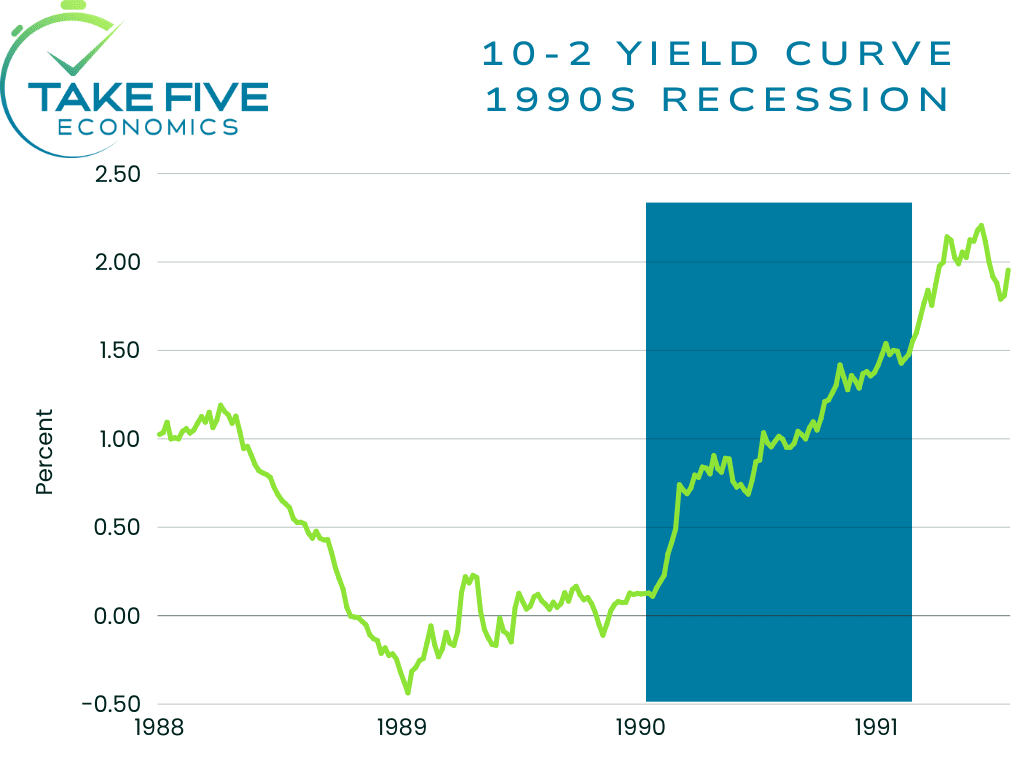
The early 90’s saw the yield curve inversion peak in March of 1989, and began to steepen fully in mid 1990 as the U.S. was entering a recession. This example isn’t as remembered given that it was minor compared to the rest, but it still applies. This was an example of a bear steepening.
Stock Market:
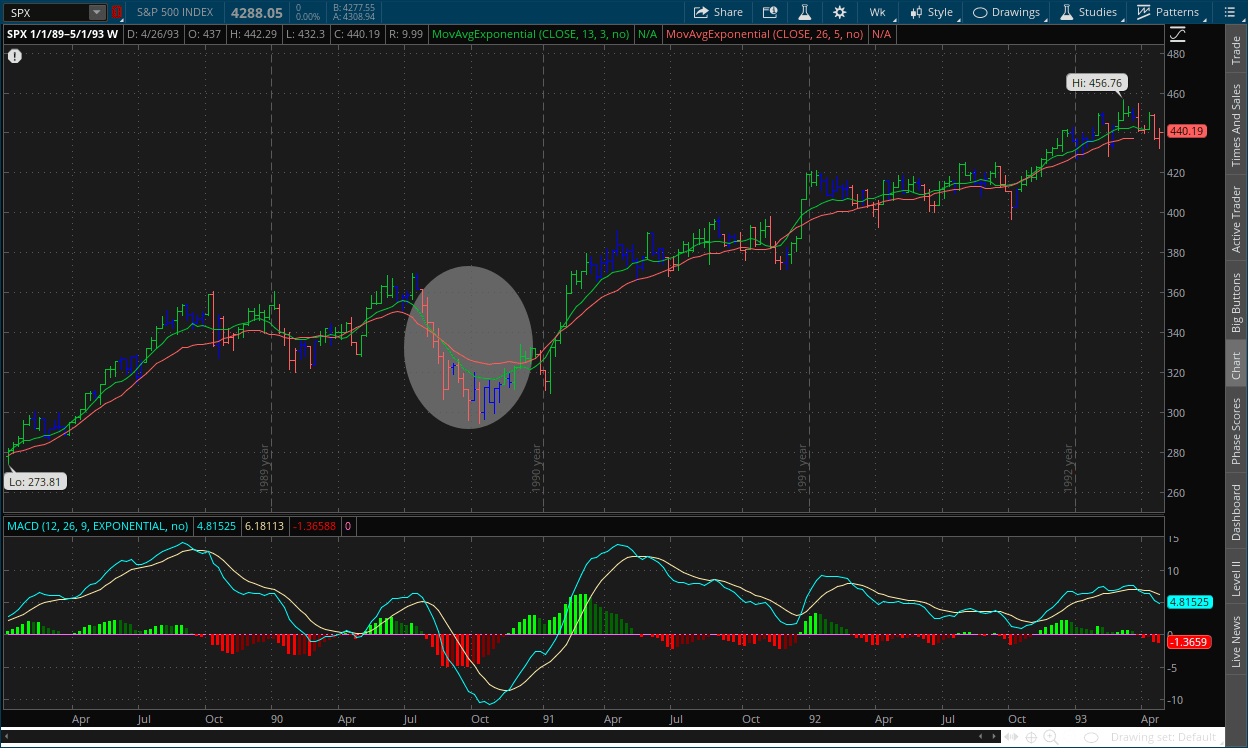
The stock market began to decline just after the yield curve began to steepen, and the S&P would lose nearly -22% from its highest point following the steepening. Again, notice when you compare the chart of the yield curve and the S&P, euphoric highs in the market are accompanied with the inversion of the yield curve.
Early 2000s Dotcom Bubble:
Yield Curve:
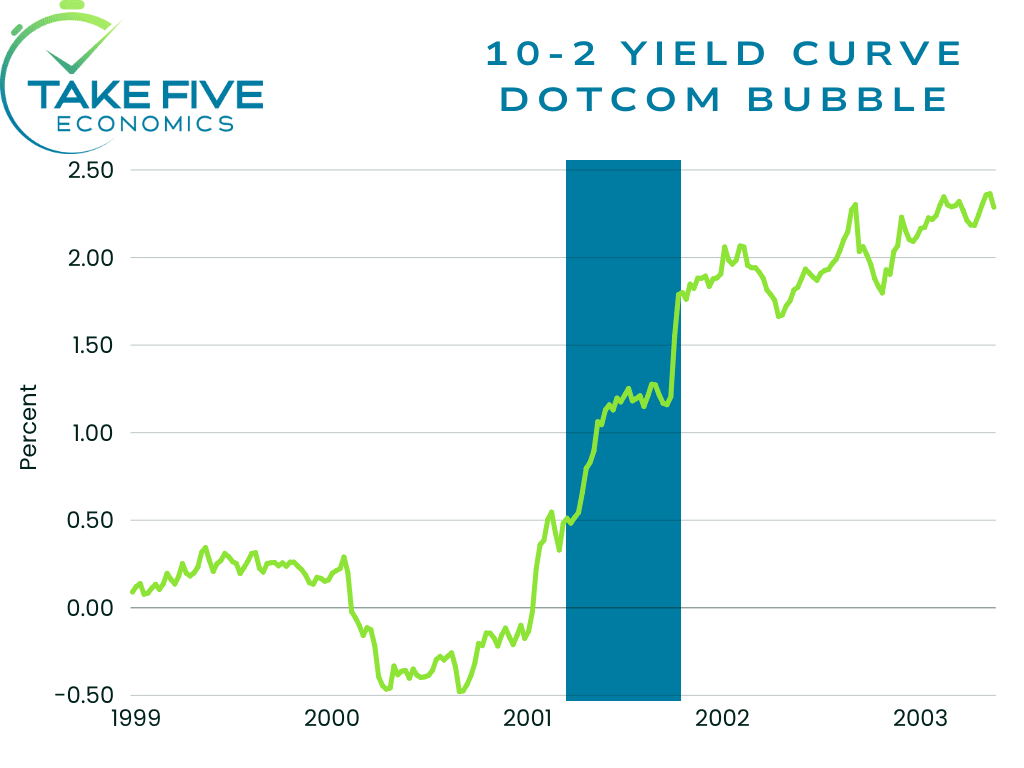
The yield curve began to steepen at the end of December in 2000 as we were heading into the new year, and began this process just before the economy was heading into a recessionary environment which took place about three months following and this was also a bear steepening.
Stock Market:
The Dotcom bubble began to burst just as the steepening began at the end of the year 2000. The inversion period was during the euphoric highs of 1999 and the first chunk of 2000 and the S&P would go on to lose over -41% over the next two years, with the Nasdaq falling over -76%.
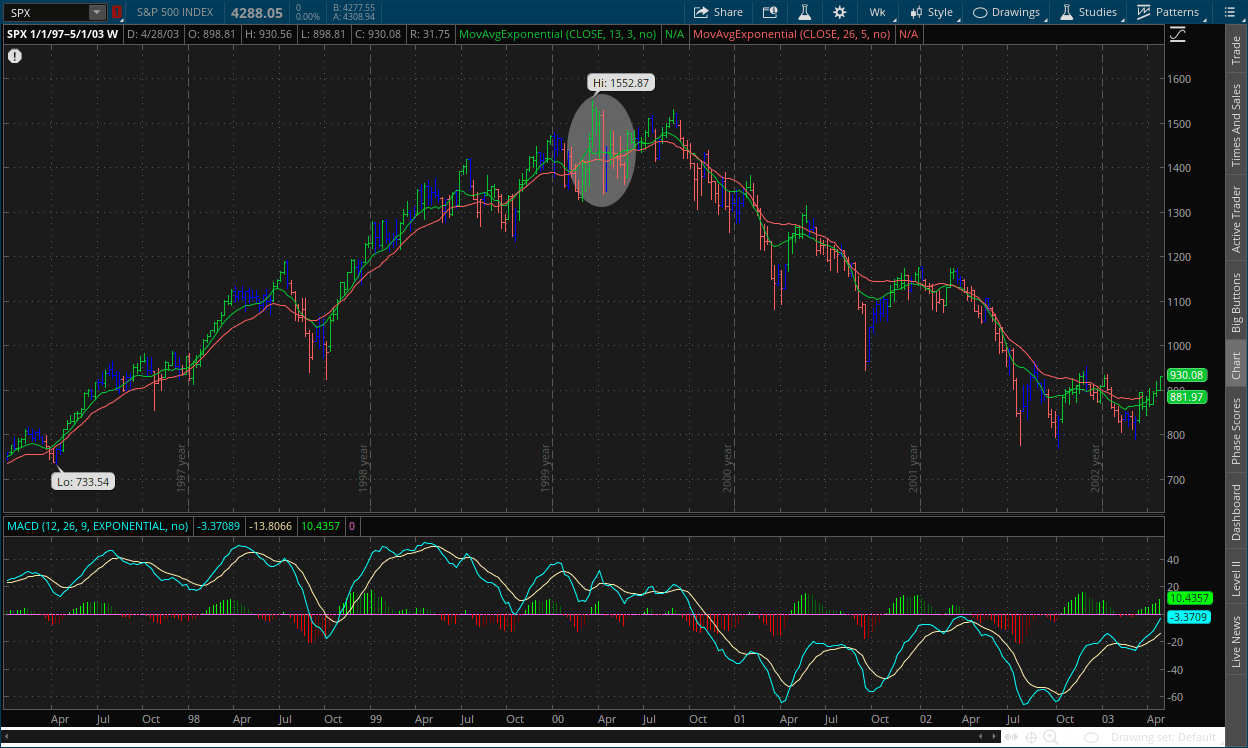
The 2008 Great Financial Crisis:
Yield Curve:
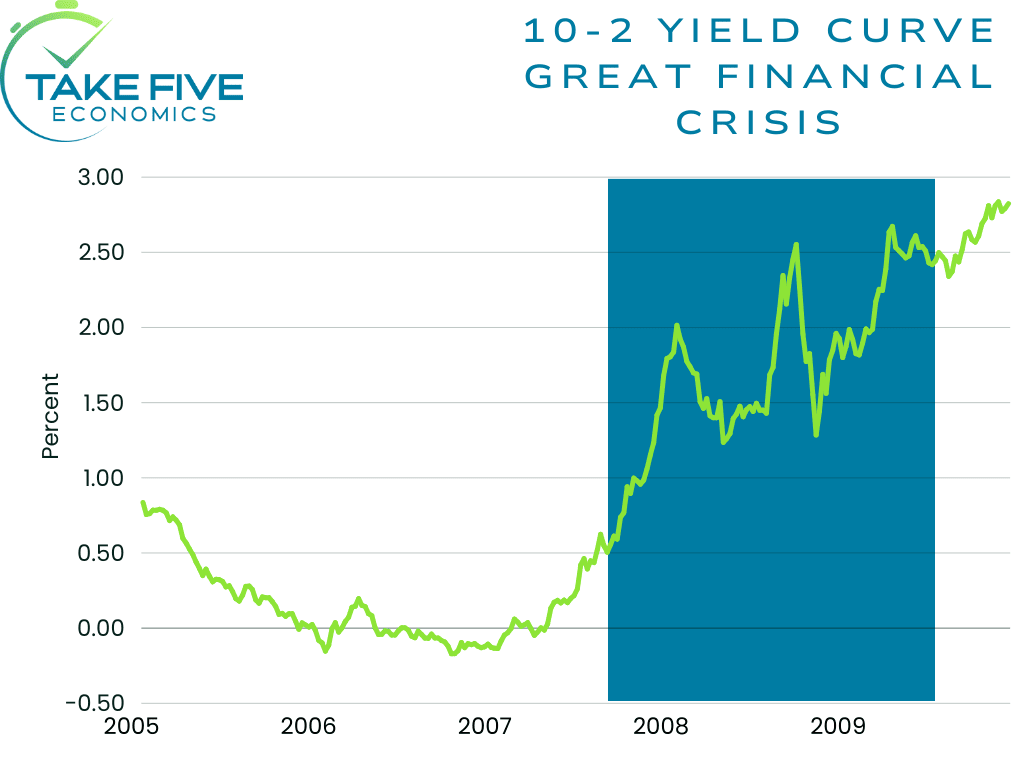
The yield curve first inverted in the beginning of 2006, and would stay inverted over the next two years (except for that one rise following the first dip). The steepening occurred in June of 2007, and the U.S. would enter the recession six months later in the beginning of 2008. Another example of a bear steepening.
Stock Market:
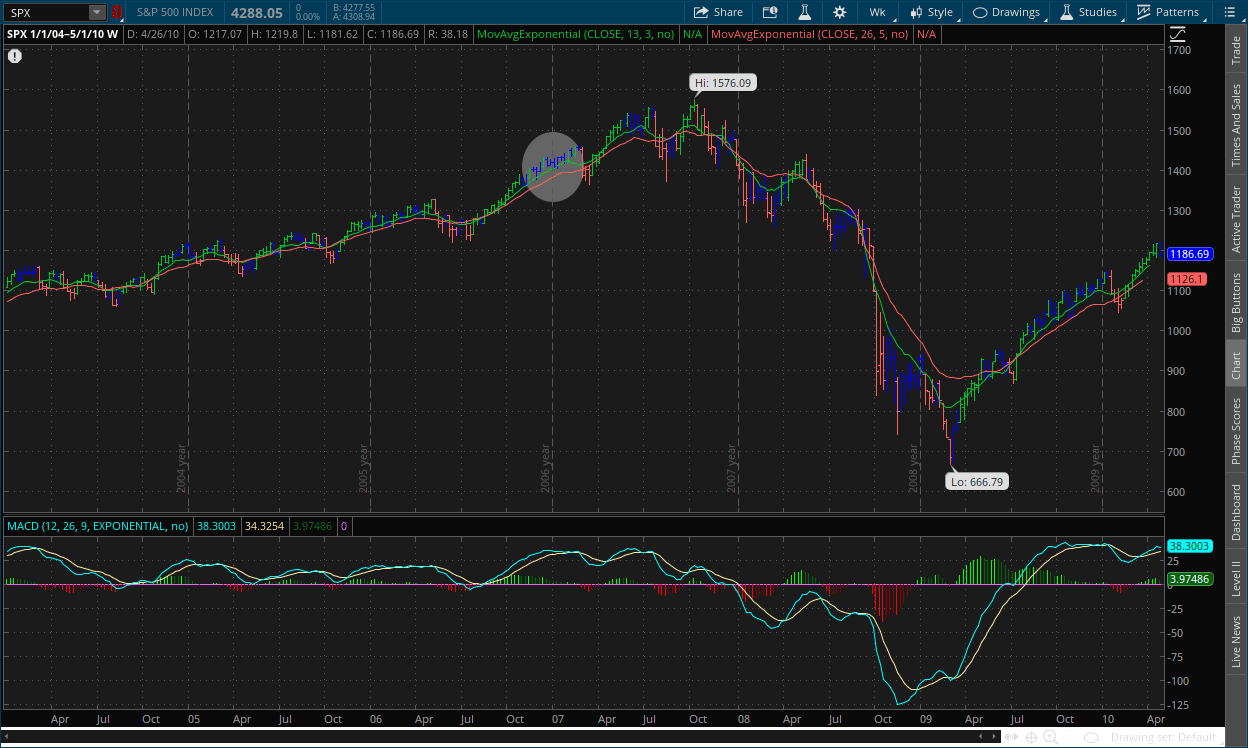
As you can see, the inversion period was accompanied once again by euphoric highs in the stock market. The steepening (highlighted by the oval) occurred about six months before the eventual fall of the global economy. The S&P would go on to lose more than -56% from October of 2007 to March of 2009.
2022-2023:
Yield Curve:
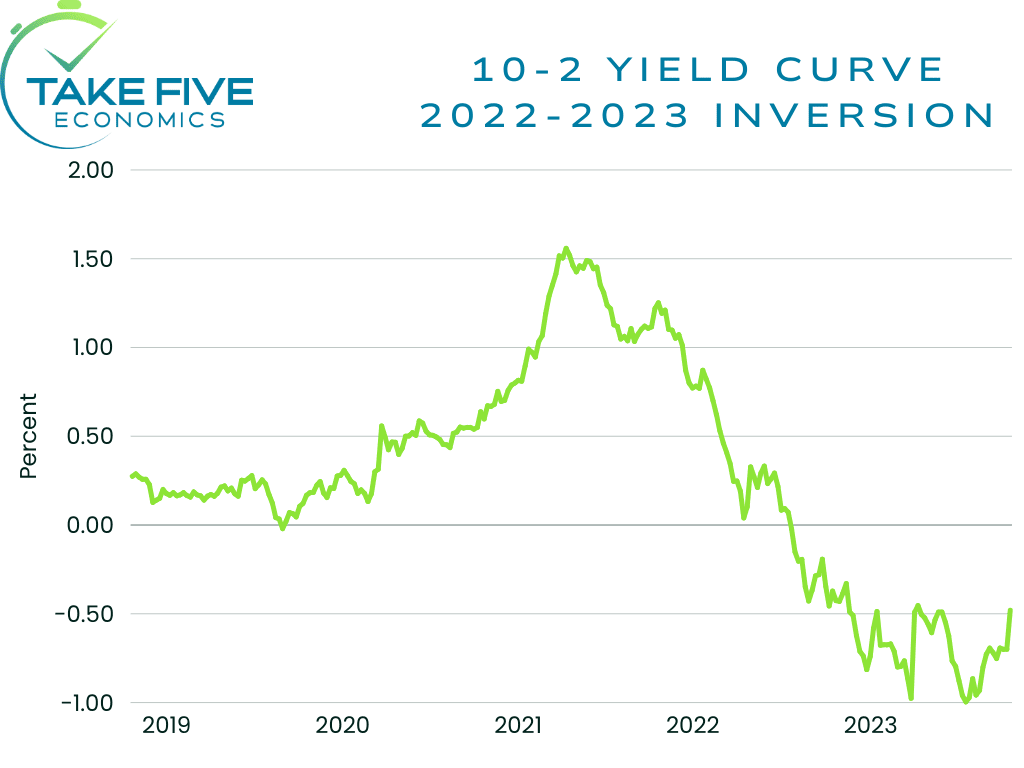
The 10-2 spread initially inverted in July of 2022 as the Fed continued to raise rates. It reached its lowest point of -120 basis points in the beginning of March, the second largest spread in history, only behind the early 1980’s inversion. The collapse of SVB on March 10 shocked the market, and steepened the yield curve as a result. It would eventually fall again to -110 basis points at its lowest. But since that point, it has begun to steepen again, and has the characteristics of a bear steepening. See Friday’s report for an in depth breakdown.
Stock Market:
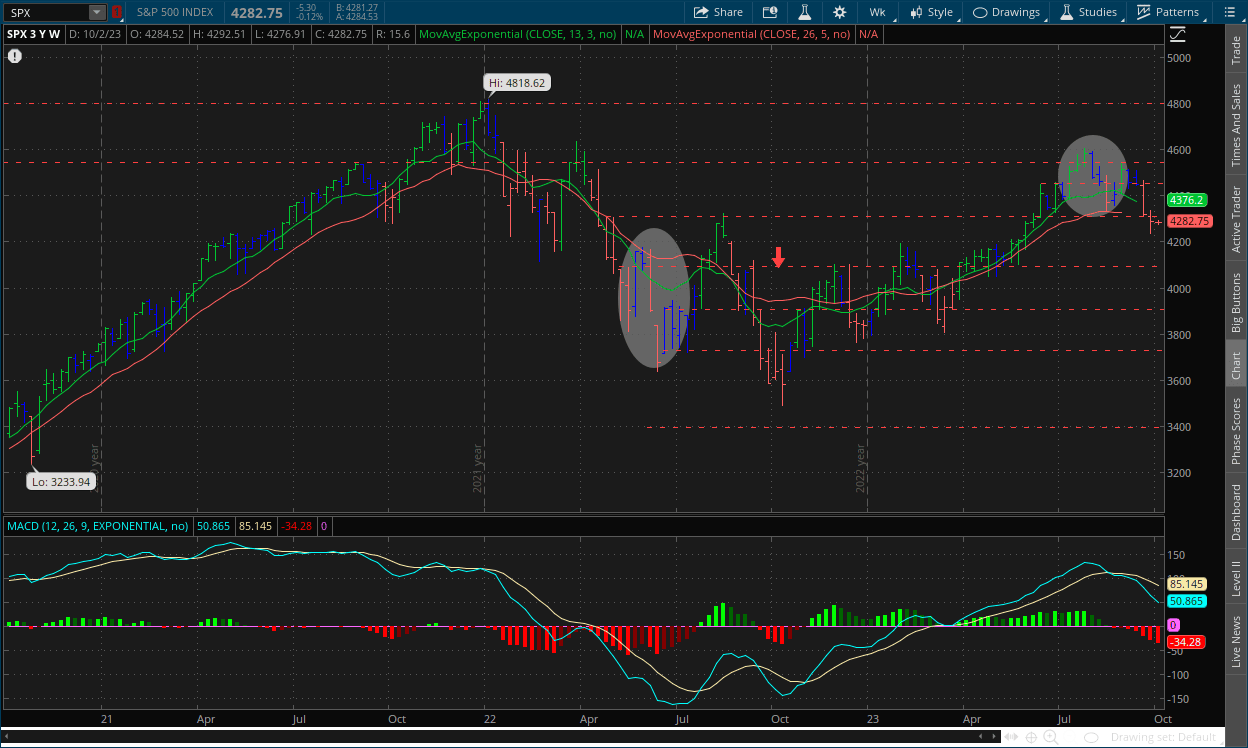
About four months following the yield curve’s inversion, the S&P began a euphoric rallying period that not even the banking crisis in March could break. As prices rallied, the inversion deepened again until we reached August. The S&P started to sputter and decline as the spread began to thin, and as it continues to get thinner (-44 basis points as of Friday), stocks are beginning to fall more and more.
Putting It Together:
The inversion of the yield curve tends to serve as a warning signal to the economy, and that there are serious underlying fundamental problems beneath the surface. However, these things take time for the economy to feel the effects, and during that time people tend to forget or get impatient, thus helping to fuel euphoric rallies despite the underlying fundamentals continuing to get worse. When the yield curve begins to steepen, that is typically when something is on the cusp of breaking. And when something breaks, that’s when the economy steamrolls into a recession, and the market reaches the edge of the cliff. One valid argument that this time is different, is that long term inflation expectations are lower, but near term are higher, thus resulting in the 10-year yields being lower than the 2-year. But everything else points to the same outcome as the previous cases. As said on Friday, today is another example of a bear steepening.
As for our bond market outlook, yields have a little bit more upside, but not too much as they'll most likely be capped around this point given their relation to the Fed's terminal rate. If the Fed does ultimately continue to hold interest rates steady, bond yields will ultimately do the same. But as soon as they give off some sort of signal that rate cuts are in sight, it gives investors the incentive to purchase treasuries again, at least the 2-year, which will drive yields down as cuts are priced in. In turn however, this could also cause the yield curve to steepen and uninver once again, but time will tell.
IV
Market Psychology & Final Thoughts:
Bond yields are rallying as markets in the US and Europe begin to sell off. Crude futures are edging down as well, and the VIX is rallying. Markets may be entering a short consolidation period as they prepare for important labor market data later in the week. The JOLTS data will be released tomorrow, ADP employment change report is slated for Wednesday, and the BLA labor market data is on tap for Friday. As always, we hope you found this helpful, learned something about the historical context of the yield curve signal, and have a decent Monday.