The Take Five Report: 10/16/23
I
Markets:
I-I
Global Market Recap:
United States:
- S&P: -0.50%
- Dow: +0.12%
- Nasdaq: -1.23%
- Russell 2k: -0.84%
U.S. indexes opened Friday’s session in positive territory but it wouldn’t last long following the University of Michigan’s consumer sentiment survey. The S&P, Nasdaq, and Russell 2000 indexes swiftly sold off for the remainder of the day. The Dow managed to remain afloat and flat following the selloff, and managed to eke out a marginal gain to cap off the week.
Asia:
- Shanghai: -0.46%
- Hong Kong: -0.97%
- Japan: -2.03%
- India: -0.17%
Asian markets this morning mostly fell with Japan pacing declines as market participants look ahead to key economic data this week. China is releasing its Q3 GDP on Wednesday, with expectations slated at 4.4% compared to 6.3% in Q2. Japan’s September inflation will be released Friday, which comes ahead of the central bank’s policy meeting at the end of the month.
Europe:
- UK: -0.59%
- Germany: -1.55%
- France: -1.42%
- Italy: -0.90%
European markets closed vastly lower in Friday’s session as global sentiment and outlook is beginning to falter and deteriorate. European markets had a strong week before Friday’s drop as earnings from financial institutions were mostly positive.
I-II
U.S. Sectors Snapshot:
- Communication Services: -1.32%
- Consumer Discretionary: -1.46%
- Consumer Staples: +0.84%
- Energy: +2.25%
- Financials: +0.20%
- Health Care: +0.61%
- Industrials: -0.86%
- Info Tech: -1.52%
- Materials: -0.37%
- Real Estate: -0.04%
- Utilities: +1.09%
II
Technicals:
II-I
Volatility Index: (VIX)
Weekly Chart:
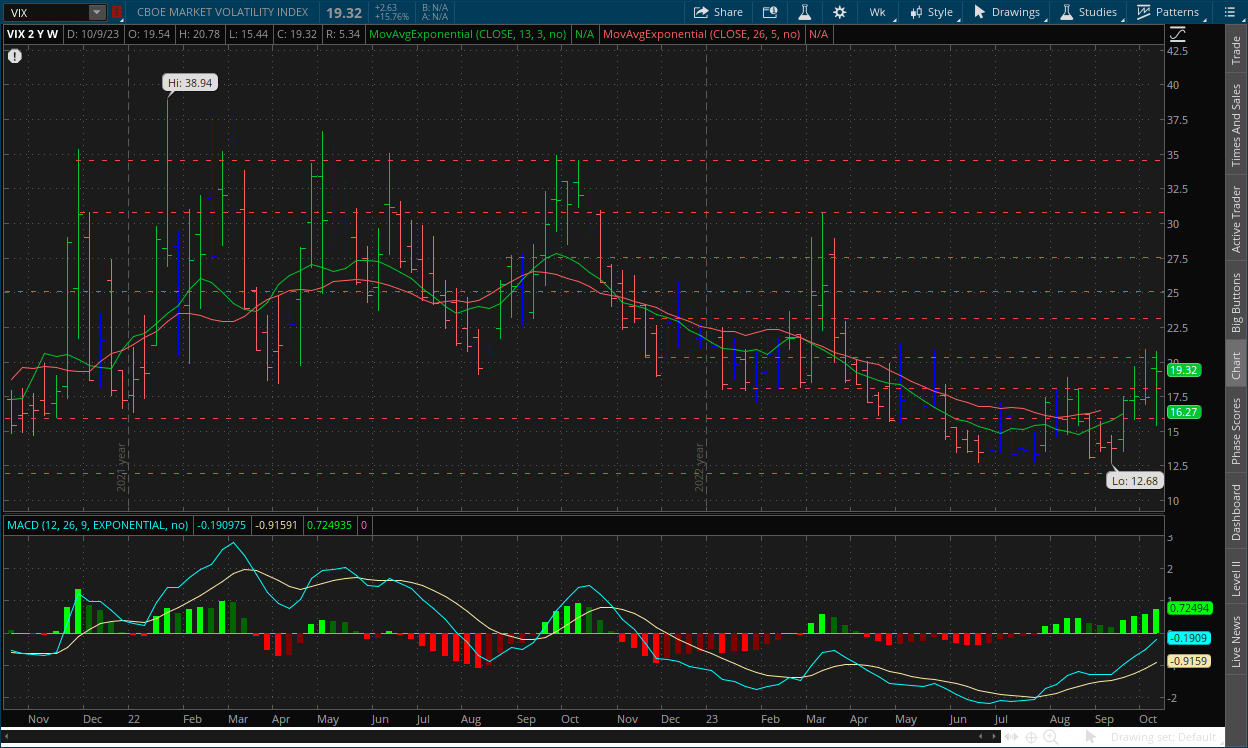
The VIX went through a lot of ups and downs this week, opening well above the previous week at $19.54, then working to a low of $15.44 in the middle portion. Prices would reach a high of $20.78 on Friday after a monster rally, and would ultimately close at $19.32.
Strength continued to move in favor of the VIX bulls and rather strongly compared to the previous two weeks. Inertia is still shifting more to the upside on the front end, but the VIX bulls still have a lot of work to do.
The triple bullish divergence in the VIX has done its job so far, but we don’t think the rise in volatility is done yet. Given the combination of signals we’re seeing from the technical and fundamental forces, as well as the psychology of market participants, the VIX has more momentum by the way to the upside than downside for now, but that is subject to change if there is a strong enough fundamental catalyst that causes a psychological shift, and signs of that shift would reflect on the charts in some way or another (most of the time).
Daily Chart:
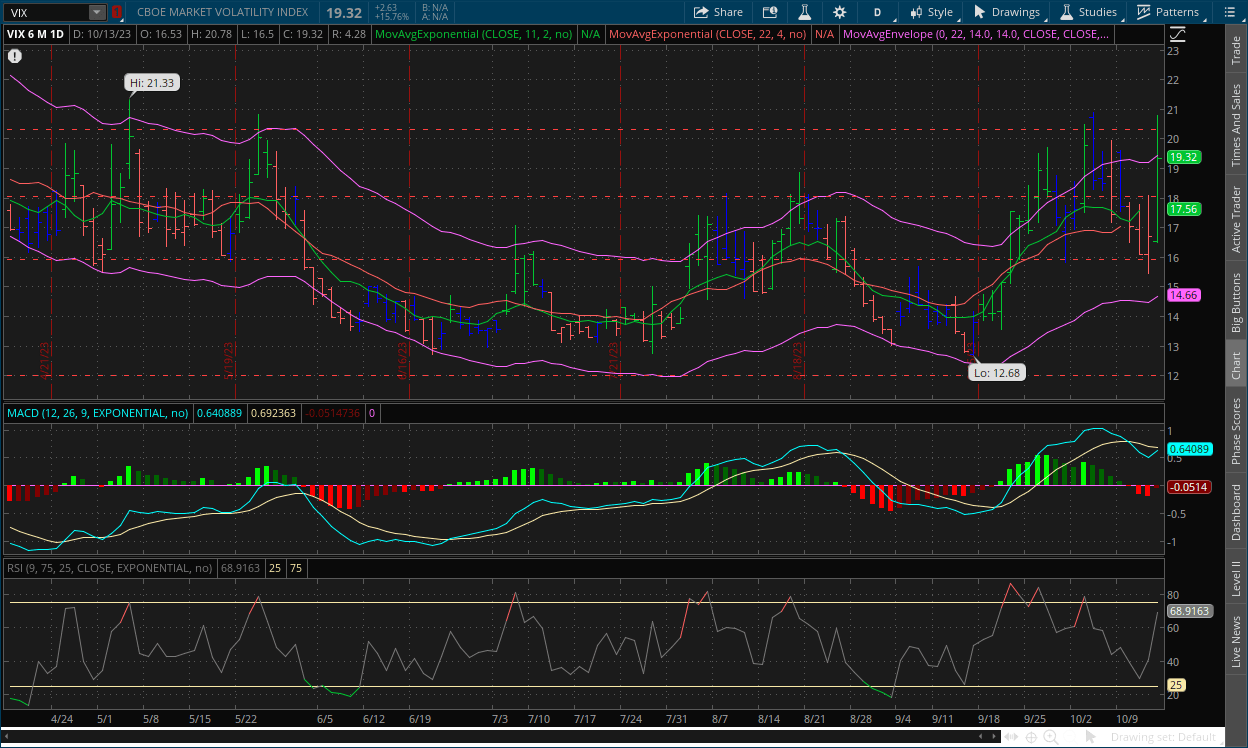
Strength moved back in favor of the VIX bulls after seven straight sessions. As we said in previous reports, the next cycle below the centerline will likely be weak in comparison to the previous ones, because we expected prices to consolidate overall rather than decline. Inertia edged back towards the upside following the consolidation.
The key for the VIX bulls last week was keeping prices above $16, as they did the week prior as well. We've been saying that if they have any hope to sustain this rally, that would be the level they need to keep prices above and they’ve done their job so far. They’ve been struggling to break above $20 however and sustain it, so therefore we have our new true resistance in this next phase of the rally as prices consolidate. This next phase of consolidation has seen much larger price swings compared to the previous consolidation range, and we think that should be expected if the rally continues (i.e. larger price swings as prices rise).
II-II
S&P 500: (SPX)
Weekly Chart:
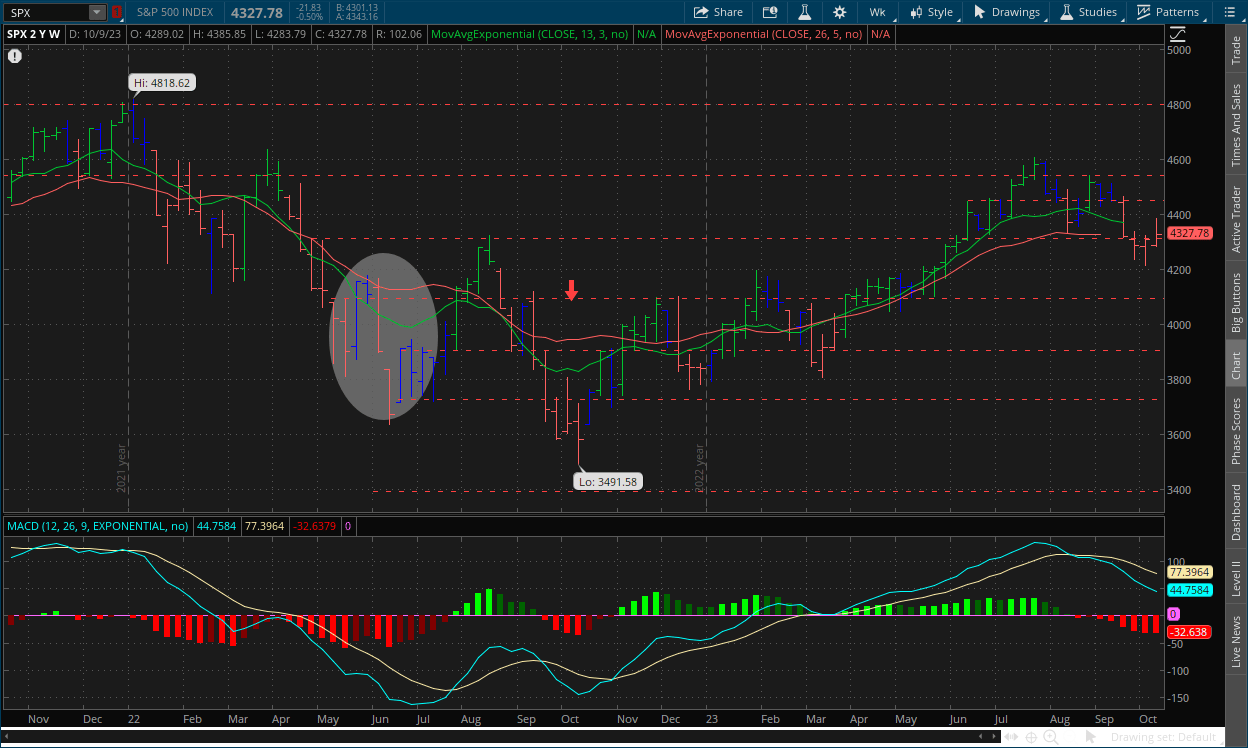
The S&P opened the week at $4,289, reaching a low of $4,283 on day one and would rally through Thursday, reaching a high of $4,385 before Friday’s selloff caused the benchmark index to close at $4,327.
Strength continued to move narrowly more in favor of the bears as their momentum has sputtered in recent weeks while inertia is still edging towards the downside, but remains overall bullish.
Due to the higher for longer, the S&P is limited to how much it can truly rise until that narrative is broken, or at least until talks of rate cuts begin. A breakout above new highs (i.e. $4,818) is a pipe dream as of right now. The upside is extremely limited, while the downside is vast. The bulls brought prices back above the $4,300 level last week, and we do believe that some consolidation around this mark is in store. But we still do believe the bears win out, and eventually take the $4,300 level as well.
Daily Chart:
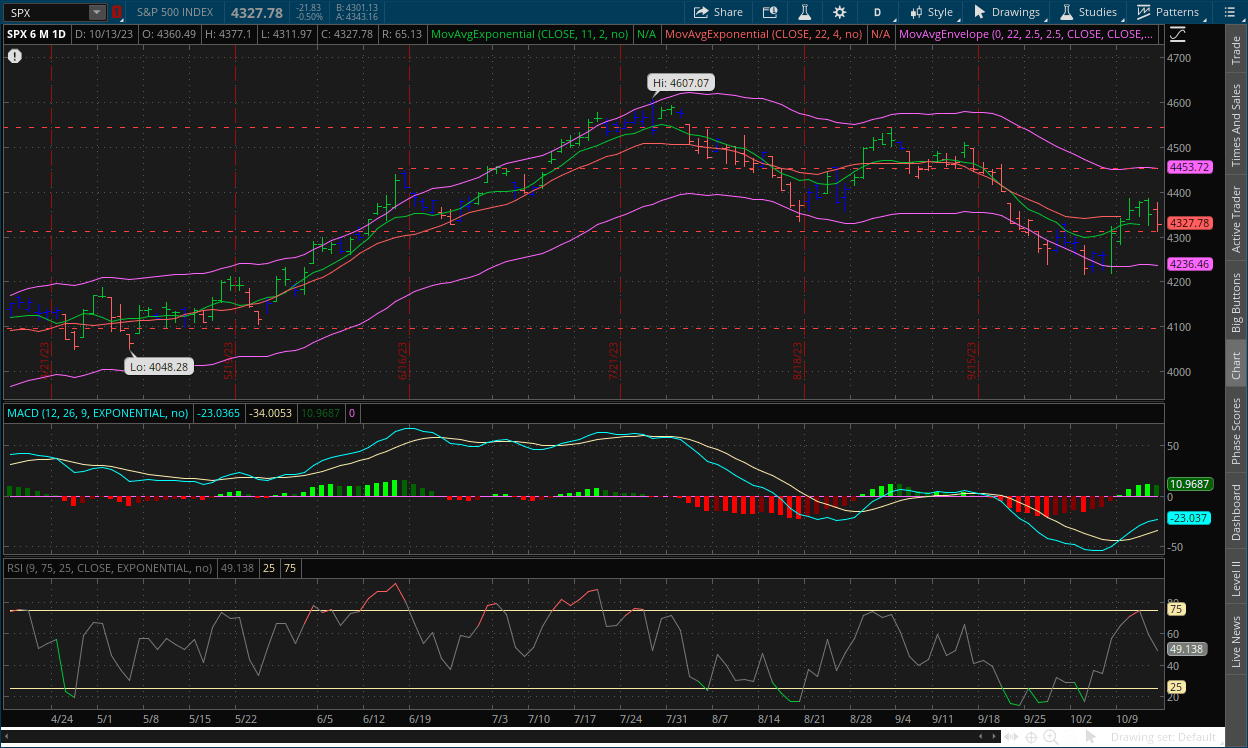
Strength moved in favor of the bears for the first time in seven sessions as they gained some ground back. Inertia started to flatten out slightly, but remains in an overall downward trajectory over roughly the last three months.
If you remember a few weeks ago, we said that there is a possibility a bullish divergence could develop within the MACD-H. We did end up getting that, as well as its activation, but as we also said, it is likely to be weak as the difference between the two lows is minimal. Going forward further consolidation is likely in store, but the downside potential is vast. With everything going on around the world and domestically, there are ample negative catalysts compared to positive ones.
III
Fundamentals:
III-I
Headlines:
1.) MarketWatch: Oil prices in spotlight as Iran warn of escalation in Israel-Hamas war
2.) MarketWatch: Israel-Gaza conflict threatens to reawaken U.S. inflation, investors worry
- T5 note: We don’t believe it will end up being the case, or should end up being the case but it's all about inflation expectations as you all know by now (see below)
3.) Wall Street Journal: Rite Aid files for bankruptcy, undone by years of losses
4.) Wall Street Journal: Eurozone posts trade surplus in August after Russian imports tumbled
5.) Bloomberg: Wall Street strategists sound alarm on worsening profit outlook
6.) Financial Times: Italy unveils €24 billion in tax cuts and pay raises to spur faltering growth
III-II
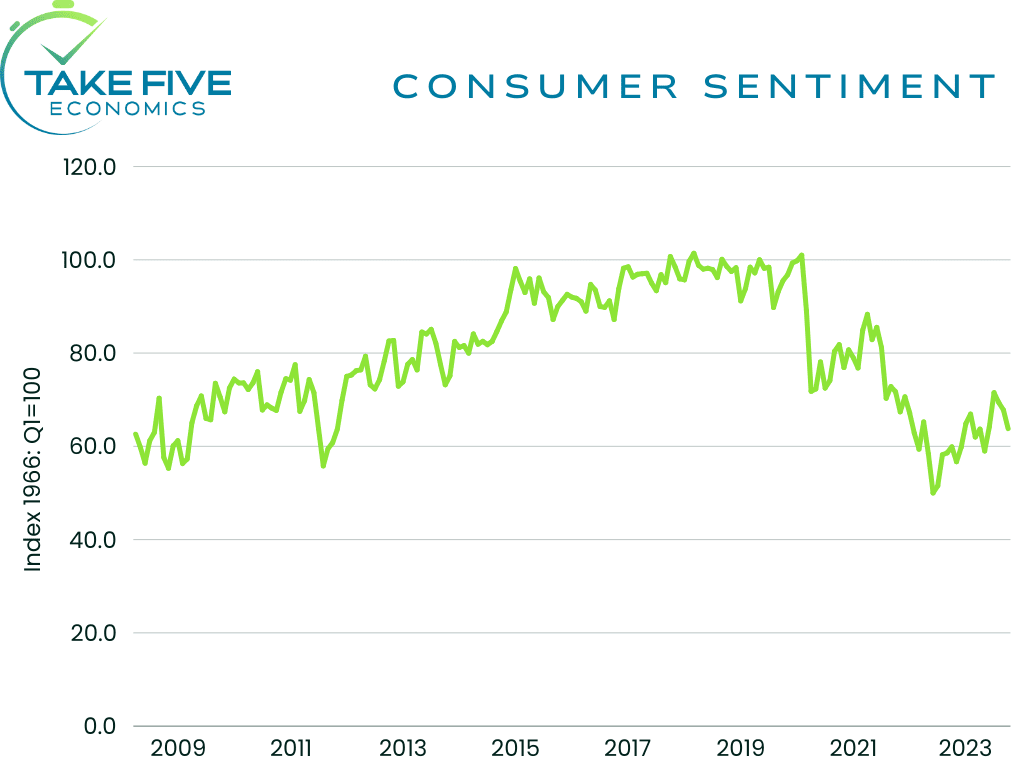
University of Michigan Consumer Sentiment Report for October - Prelim:
Highlights:
|
Index: |
September Final: |
October Prelim: |
Wall Street Expectations: |
Take Five Expectations: |
|---|---|---|---|---|
|
Sentiment: |
68.1 |
63.0 |
67.5 |
62.0 |
The preliminary reading for consumer sentiment showed a reading of 63.0 compared to 68.1 in September, coming in much lower than Wall Street expectations and slightly above our own. The index is still up from the same period a year ago however, when it stood at 59.9.
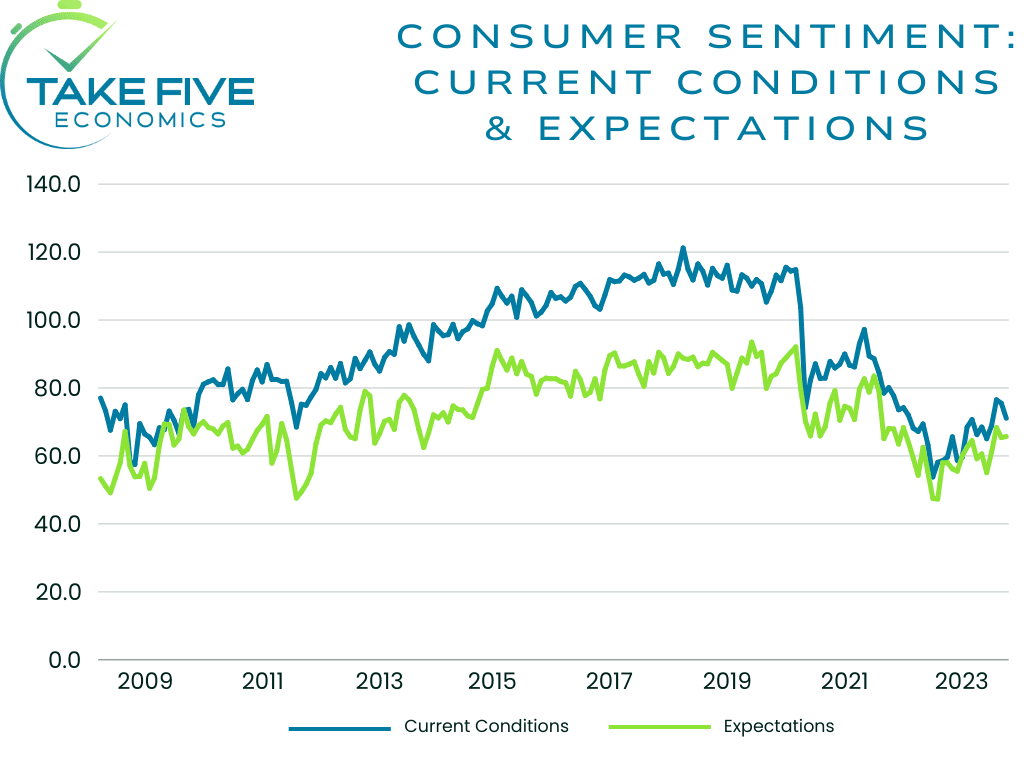
Finer Details:
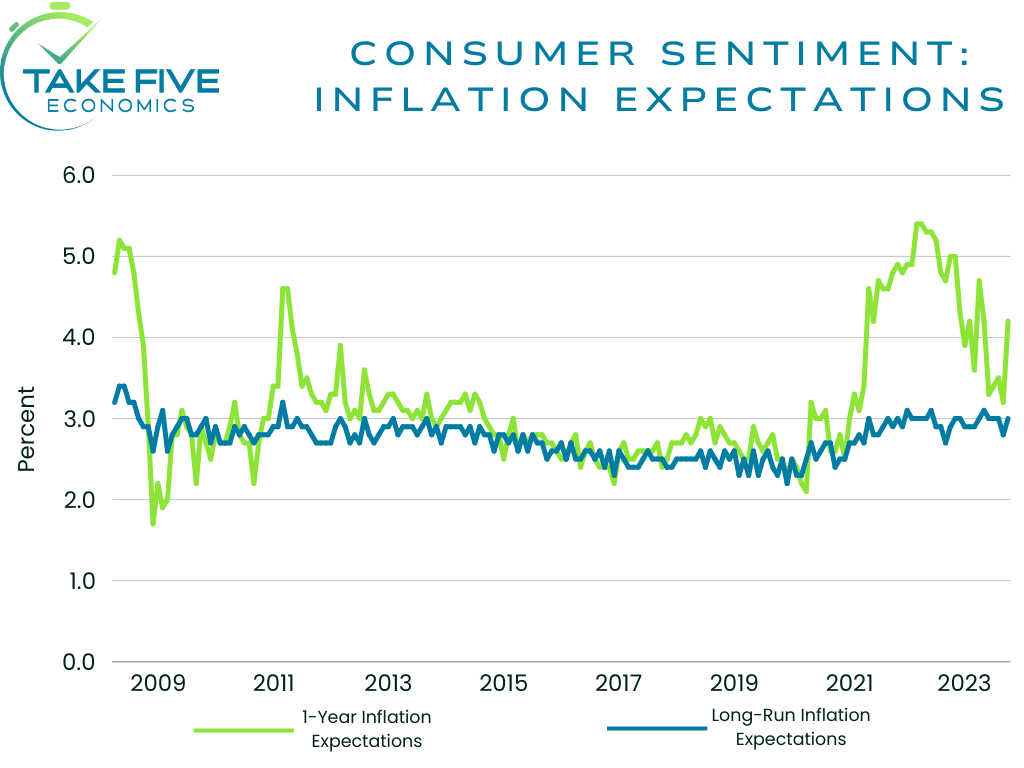
The index for current economic conditions fell in similar fashion, falling from 71.4 in September to 66.7 this month. Future expectations declined rather significantly as well, from 66.0 to 60.7. What was eye catching however was inflation expectations. One-year inflation expectations popped from 3.2% to 3.8%. Five-year inflation expectations increased to 3.0% from 2.8% last month, but this remained within what is considered the normal current range.
Putting It Together:
This report did not help the bulls’ case, as all indexes moved to their lowest in months. Again, the eye catcher was one-year inflation expectations. To reiterate why we don’t want to see this start to de-anchor: If people are expecting inflation to rise, they buy more supply of whatever they need in order to avoid paying more for it later. When you have people doing this en masse, it creates a self-fulfilling prophecy, and contributes to rising inflation as demand rises against the supply. This is what happened in the UK and most of Europe earlier this year. Given everything that is going on in the world right now, it has people worried about supply chains, especially for oil. But that is a topic for another time.
IV
Market Psychology & Final Thoughts:
Psychology:
Given the current geopolitical climate reviving inflationary fears in addition to the concern already being expressed about the global economic outlook, market participants are on edge to say the least no matter which way you look at it. The technical signals are mostly bearish moving forward besides the minor bullish divergence in the MACD-H on the daily chart of the S&P, and volume numbers are drying up to pre-covid levels. The fundamentals are also still trending in a similar direction and now with the outbreak of war in the middle east, they’re only getting worse.
Final Thoughts:
Index futures are up as we head towards the open along with European markets. The VIX and crude futures trading lower as well. However, bond yields are rising, with the 30 and 10 year notes up 8 basis points and 6 basis points respectively. The open for the week will likely be positive, but based on premarket movements there isn’t a lot of fuel for the bulls, and it could easily flip at some point throughout the day. We hope you found this at the bare minimum somewhat useful, learned why inflation expectations are so important, and have a great Monday.