The Take Five Report: 10/23/23
I
Markets:
I-I
Global Market Recap:
United States:
- S&P: -1.26%
- Dow: -0.86%
- Nasdaq: -1.53%
- Russell 2k: -1.29%
U.S. indexes opened Friday’s session around the breakeven mark, and would immediately start to sell off in the opening minutes, but would smooth a little before the halfway point. Prices would remain steady for a while, but a late day sell off drove markets’ sell off even further, and they would cap off the week once again in the red.
Asia:
- Shanghai: -1.47%
- Hong Kong: -0.72%
- Japan: -0.83%
- India: -1.26%
Asian markets continued getting beat down in this morning’s session ahead of a week of inflation readings across the region and South Korea’s Q3 GDP figures. Australia will release inflation figures for September on Wednesday, while Japan will release theirs on Friday. Mainland Chinese indexes finished at their lowest level since February 2019.
Europe:
- UK: -1.30%
- Germany: -1.64%
- France: -1.52%
- Italy: -1.40%
European markets dropped significantly in Friday’s session, with Germany pacing the declines as escalation in the Middle East along with the higher for longer narrative continue to weigh on global markets.
I-II
U.S. Sectors Snapshot:
- Communication Services: -1.15%
- Consumer Discretionary: -1.66%
- Consumer Staples: -0.38%
- Energy: -1.74%
- Financials: -1.55%
- Health Care: -0.40%
- Industrials: -1.03%
- Info Tech: -1.69%
- Materials: -1.29%
- Real Estate: -1.04%
- Utilities: -1.05%
II
Technicals:
II-I
Volatility Index: (VIX)
Weekly Chart:
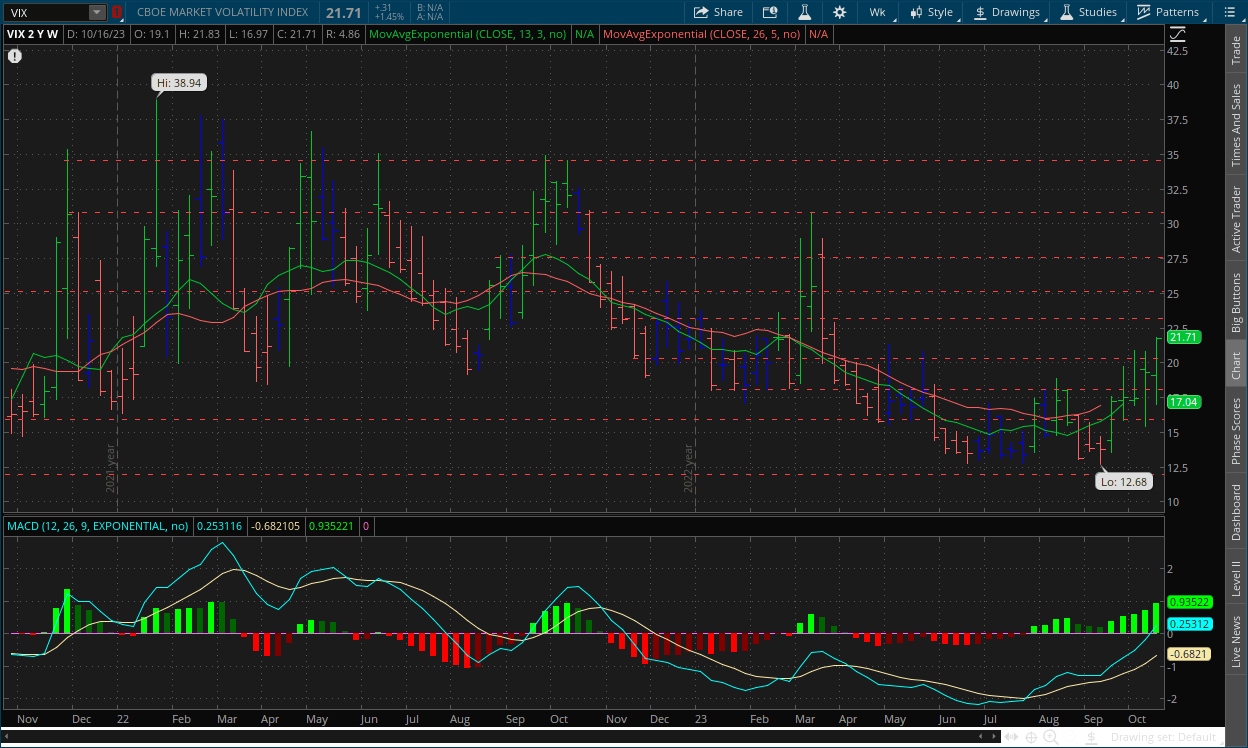
The VIX opened last week at $19.10 and worked to a low of $17.04 in the first few days. Prices rallied in the second half of the week and reached a high of $21.83 on Friday before closing at $21.71.
Strength moved convincingly in favor of the VIX bulls compared to previous weeks, as the indicator has reached the point where it’s gotten stopped in the past before turning back around. Inertia continued to shift towards the upside as the VIX bulls continued to push prices higher.
The VIX in this longer-term view still hasn’t made too much progress. Historically, the MACD-H on the VIX doesn’t stay above the centerline like it is now for too long, and it tends to have strong reversals back to the downside, especially during the first week of the reversal. This could be what's in store for the VIX. The rally following the triple divergence's activation has moved the volatility index quite a bit, but not enough to fully reverse its trend. The fact that the indicator has only rallied this much compared to others on this chart, combined with prices struggling to break above $20 is showing the VIX bulls are losing their momentum and given where the MACD-H resides in its cycle above the centerline, it doesn't bode well for the VIX bulls. Yes, this may sound like a flip-flop from us, but we've been hinting at the possibility for some time and we're now seeing some things that we may have overlooked, e.g. putting a bit more emphasis on the daily charts compared to the weekly's.
Daily Chart:
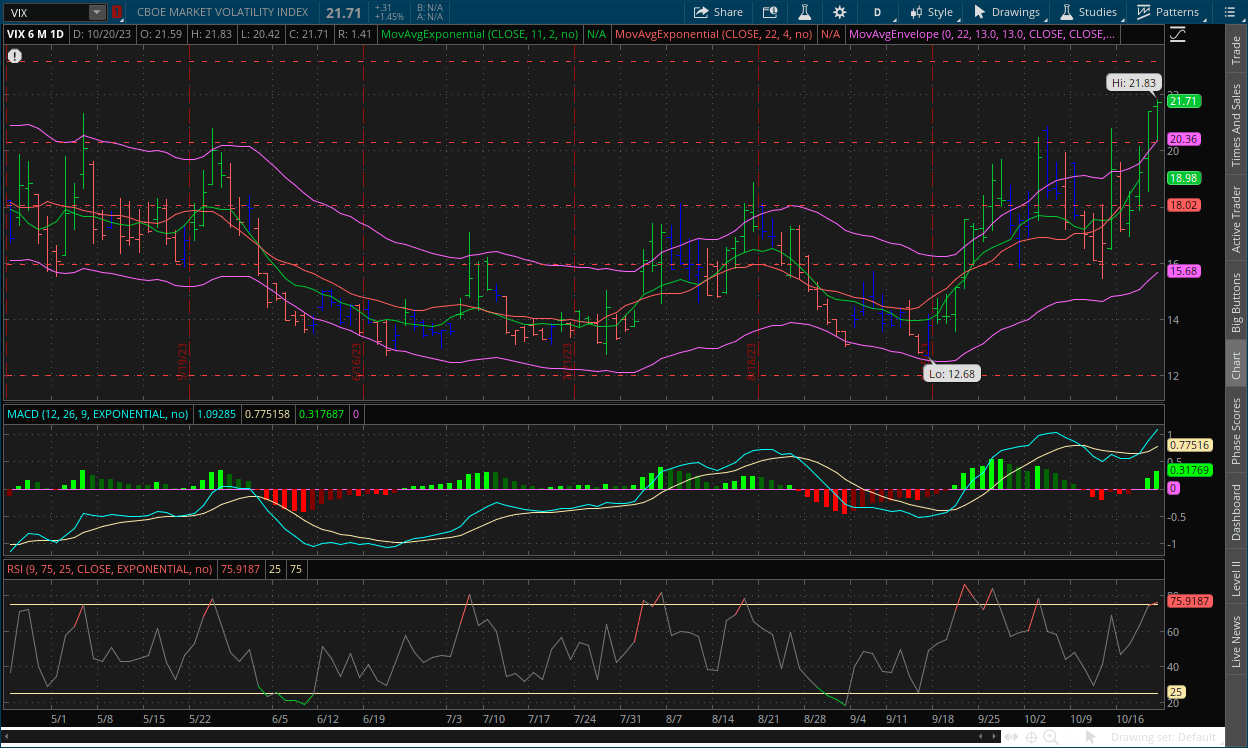
Strength continued its ascent in favor of the VIX bulls as they started off their new cycle above the centerline with conviction. Inertia continues to shift heavily to the upside, adding more upward pressure to prices.
As said above, we may have been putting more emphasis on the daily chart's recently and neglecting our focus on the weeklies, but luckily, we caught it in time, and it didn't cost us a potential whipsaw in our analysis. The weekly chart for the VIX is running out of steam, and the MACD-H is nearing the end of its cycle above the centerline. The triple divergence hasn't moved prices to the extent that we thought it would and given the positioning of prices and the MACD-H on the daily chart, this may be the last-ditch effort by the VIX bulls to move prices further before the VIX bears ultimately put a dent in this rally. The one thing we do have to consider however is the lack of a positive overall direction in the fundamental force at this current moment in time, which gives the rally in the VIX or the decline in the S&P more room to fall. But as we've been saying, this could change with a positive catalyst from that side of things. One thing to note as well is the possibility of a bearish divergence developing on the chart, similar to how the S&P developed a bullish divergence on its daily chart, a signal that the current trend is weakening.
II-II
S&P 500: (SPX)
Weekly Chart:
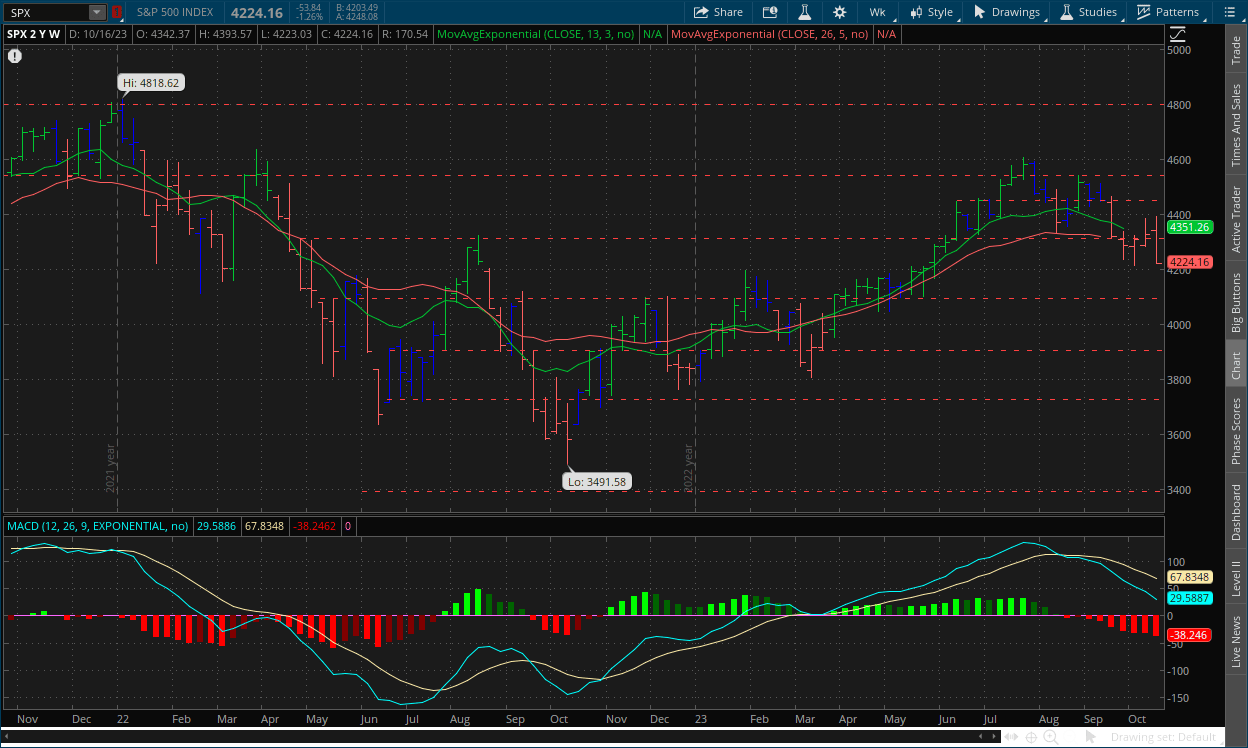
The S&P opened last week at $4,342, and worked to a high of $4,393 in the first few days of the week, as the bulls couldn’t quite push prices to the $4,400 level. Prices sank for the rest of the week, reaching their low on Friday at $4,223, and would close at $4,424.
Strength moved rather convincingly in favor of the bears in comparison to the last few weeks of them gaining very little ground. Inertia continues to shift more towards the downside as the bears are adding more downward pressure to price action.
With our more shifted view on the state of the charts, the S&P is no different from the VIX and is painting a similar picture. The bears have been losing momentum. This can be reflected in the slope of the MACD-H as well as price action around the $4,300 level. The divergence in the S&P that signaled the downside break wasn't a very strong one, and given the current positioning of the MACD-H, there is little downside potential left in this move from the bears, especially with the loss in momentum. For the rest of the analysis, see the section on the daily chart below.
Daily Chart:
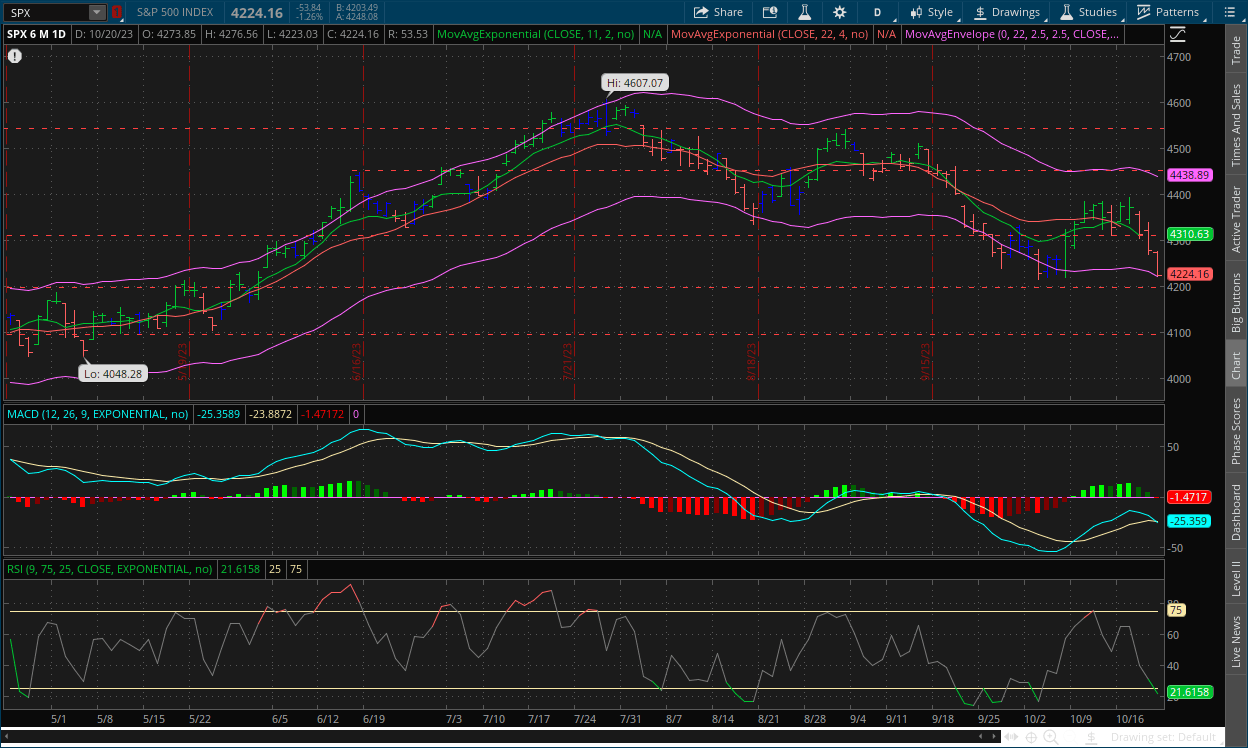
Strength moved in favor of the bears once again as they officially broke below the centerline and will attempt to start a fresh cycle below it. Inertia continues to shift towards more downward pressure on the front end, and the back end is now moving in that direction as well.
The daily chart showed a bullish divergence in the MACD-H in its previous cycles below the centerline. While the VIX's daily chart didn't show this, it is now starting to develop one (except it could be a bearish divergence because the VIX moves inversely to the S&P). Although the bears have more downside momentum and potential on the daily chart, given the signals we see on the weekly chart, this may be the final push from the bears. But again, the one thing we lack is a positive overall direction or at least a positive catalyst from the fundamental force in order to trigger a reversal in the psychology of the market. What we may see is the bears continuing their move, but eventually run out of steam. At that point, prices would likely consolidate for a while but the market will show through the technicals that they're ready to reverse, but they won't until there is some kind of catalyst. Now, this can also be true for a bearish catalyst as well, i.e. something that will reinforce the current trend. So, it could go either way and only time will tell as we can't possibly predict what it would be or whether it would be bullish or bearish. Right now, the fundamentals are not working in the bulls' favor, but they haven't been for some time and they will be looking for anything that gives them an excuse to run. So, be on the lookout.
III
Fundamentals:
III-I
Headlines:
1.) MarketWatch: Morgan Stanley’s Mike Wilson says next rally attempt will fail as investors are punishing earnings reports
2.) MarketWatch: U.S. repeats warning it will defend Philippines after China ships ram vessels in Manila
T5 Note: Oh god please no
3.) Financial Times: American troops at risk across Middle East amid rising tensions, US warns
4.) Bloomberg: U.S. profit misses are being punished by the most in four years
III-II
10-Year Treasury Yield Hits 5%:
Highlights:
The U.S. 10 year Treasury yield has reached 5%, extending a dramatic run up in the benchmark rate that underpins borrowing costs from mortgages and student loans. If the selloff continues throughout the day, and holds above this level, it would mark the first time since July 2007 that the 10-year has settled above 5%.
What to Expect:
The Yield Curve has steepened to -10 basis points, compared to -50 basis points a few weeks ago, and from -120 basis points at it widest. The run up to 5% has been crazy to watch to say the least, but this is likely the stopping point, given where current interest rates are. Yields have very limited upside from here on out, i.e. the selling pressure on bonds will likely temper moving forward until the Fed switches course.
We've gone into detail about this before, from our 9/29 report: "Shorter term yields haven’t budged as much because their holders see no point in selling them given that the Fed likely won’t raise rates too much more and higher rates for longer. But nobody wants to buy them because money market funds (as we’ve discussed many times before) offer a.) higher yields, b.) more liquidity (i.e. ability to pull capital quickly), and c.) no risk of principal (i.e. won’t lose original investment amount, because an MMF is basically a deposit account) compared to short term treasuries."
From our 10/2 report: "If the Fed does ultimately continue to hold interest rates steady, bond yields will ultimately do the same. But as soon as they give off some sort of signal that rate cuts are in sight (i.e. they flip), it gives investors the incentive to purchase treasuries again, at least the 2-year, which will drive yields down as cuts are priced in. In turn however, this will also cause the yield curve to steepen, and potentially un-invert."
In both of these quotes, we were mostly alluding to the 2-year treasury. The 10-year yield at the time was on the rise, and what was causing the steepening of the yield curve and was driven by the higher for longer narrative. But now that short-term yields and long-term yields have caught up with each other, they'll likely hold in place for now since they closely resemble the Fed Funds Rate. But as we've said, another rate hike from the Fed will give treasuries a bit more room to run, but a Fed flip will give people a license to buy them again, creating a buying frenzy that would cause yields to drop fast.
IV
Market Psychology & Final Thoughts:
Psychology:
With tensions continuing to escalate in the Middle East, and earnings reports not looking as rosy (which we thought would likely be the case in Q3), market participants are finding more and more reasons to sell as of right now. There may be a positive catalyst to look out for this week however in the GDP figures. But you do have to think, will they take a positive GDP reading in a negative way, thinking that it’s inflationary? We know that isn’t the case, but the crowd will do what they will. The technicals seem to be shifting however, and that will be something to keep an eye on moving forward.
Final Thoughts:
U.S. markets all opened with losses, and stocks are under pressure to kick off the week. European markets are mostly in the red as well, as they enter the last hour and a half of their session. Crude futures are pulling back with bond yields on the rise once again. The yield curve has been steepening at a rapid pace as of late, and we all know the historical implications for when that inevitably does happen.We hope you found this helpful, learned more about the exciting world ofthe bond market and have a great start to the week.