The Take Five Report: 10/27/23
I
Markets:
I-I
Global Market Recap:
United States:
- S&P: -1.18%
- Dow: -0.76%
- Nasdaq: -1.76%
- Russell 2k: +0.34%
Major U.S. indexes opened slightly below the breakeven mark, and would start to sell off minutes after the open. The bulls would try to get their foot in the door a few times but were unsuccessful. Prices would continue their overall downtrend through the close, and would finish down on the day. The Russell 2000 small cap index however outperformed the broader market as speculators focused their attention there instead.
Asia:
- Shanghai: +0.99%
- Hong Kong: +2.08%
- Japan: +1.27%
- India: +1.01%
Asian markets rebounded in this morning’s session, with Australian stocks bouncing from their one year lows. Core CPI in Japan rose by 2.7% year over year in October compared to 2.5% expected. Australian PPI came in at 3.8% year over year and 1.8% quarter over quarter.
Europe:
- UK: -0.81%
- Germany: -1.08%
- France: -0.38%
- Italy: +0.29%
European markets closed mostly lower in yesterday’s session as attention remained on Q3 earnings, yields, and the U.S. GDP report. Indexes trimmed earlier losses following the ECB’s decision to hold rates steady after ten consecutive rate hikes, while the Euro remained under pressure.
I-II
U.S. Sectors Snapshot:
- Communication Services: -2.18%
- Consumer Discretionary: -1.56%
- Consumer Staples: -0.65%
- Energy: -0.78%
- Financials: -0.22%
- Health Care: -0.99%
- Industrials: -0.42%
- Info Tech: -1.91%
- Materials: +0.70%
- Real Estate: +2.11%
- Utilities: +0.86%
II
Technicals:
II-I
Volatility Index: (VIX)
Thursday Recap:
Prices opened yesterday’s session at $21.78, and worked to a high of $21.96 before sliding for the remainder of the day, reaching a low of $20.22 before closing at $20.68.
Daily Chart:
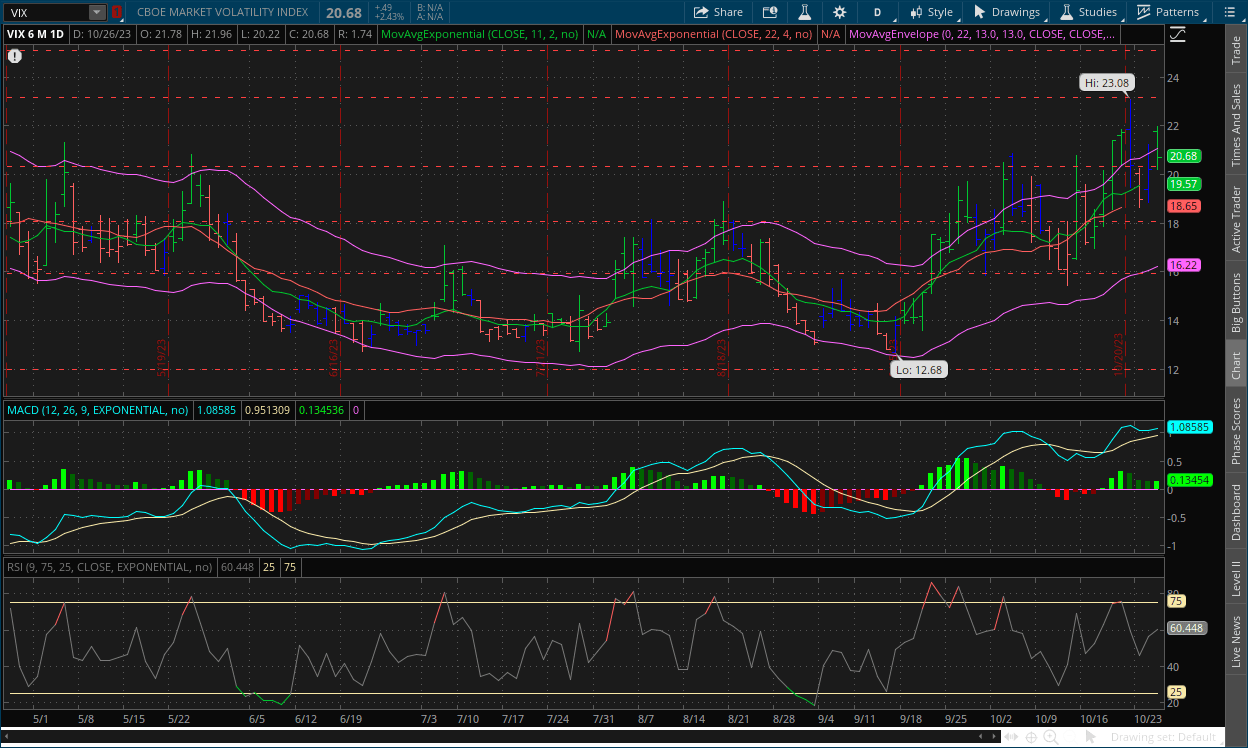
The VIX bulls managed to buck the trend in strength, moving it in their favor for the first time since last week as they look to gain some of the ground they lost back. Inertia continued to edge upwards, but prices haven’t leveled off enough or for long enough for it to have any meaningful impact so far.
The VIX bulls managed to keep prices above the $20 level in yesterday’s session. But the VIX bears are gaining more momentum underneath the surface. The key thing to watch for is how well they are able to keep prices above this level. If it’s flimsy, then that will give the VIX bears an even greater chance of bringing prices back down. Our prediction is that the VIX bulls are not going to have the strength moving forward.
II-II
S&P 500: (SPX)
Thursday Recap:
The S&P opened Thursday’s session at $4,175, and would reach a high of $4,183 in the opening minutes. Prices would bounce throughout the day, but keep an overall downward trend and reach a low of $4,127 before closing at $4,137.
Daily Chart:
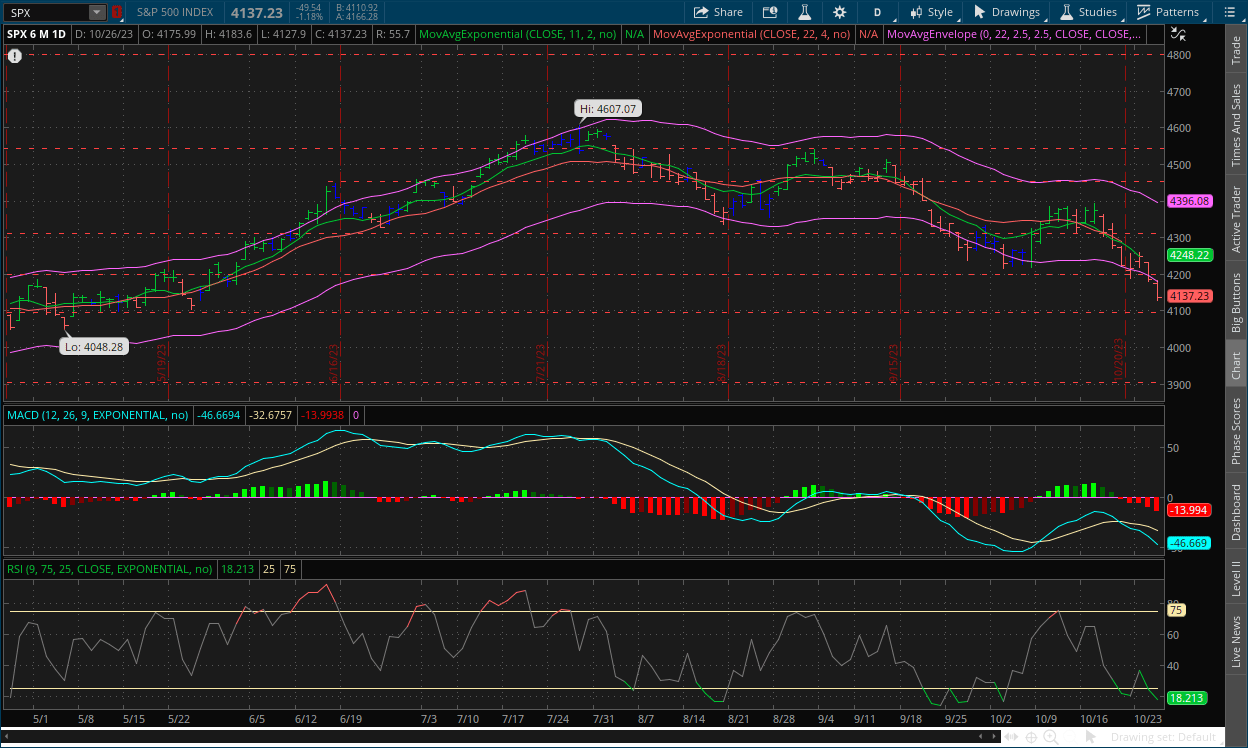
Strength continued to edge in favor of the bears in yesterday’s session as the bulls haven’t quite yet managed to put something too strong together. Inertia continued to edge more to the downside. The bears on the S&P are in a lot stronger position than the VIX bulls, but their underlying weakness is becoming more prevalent as well. The bulls may get their opportunity sooner rather than later.
III
Fundamentals:
III-I
Headlines:
1.) MarketWatch: Yellen credits economies resilience to the rise in long-term bond yields
2.) MarketWatch: Gold is officially outperforming stocks in 2023 as October rally continues
3.) Wall Street Journal: The corporate retreat from Hong Kong is accelerating
4.) Bloomberg: Why no recession yet? Thank the US consumer
T5 Note: see below
III-II
GDP Data for Q3:
Highlights:
|
Index: |
Q2: |
Q3: |
Wall Street Expectations: |
Take Five Expectations: |
|---|---|---|---|---|
|
GDP: |
2.1% |
4.9% |
4.0% |
3.5% |
|
GDP Deflator: |
1.7% |
3.5% |
2.7% |
3.0% |
|
PCE: |
0.8% |
4.0% |
x |
x |
|
Private Investment: |
5.2% |
8.4% |
x |
x |
|
Exports: |
-9.3% |
6.2% |
x |
x |
|
Imports: |
-7.6% |
5.7% |
x |
x |
|
Government Spending: |
3.3% |
4.6% |
x |
x |
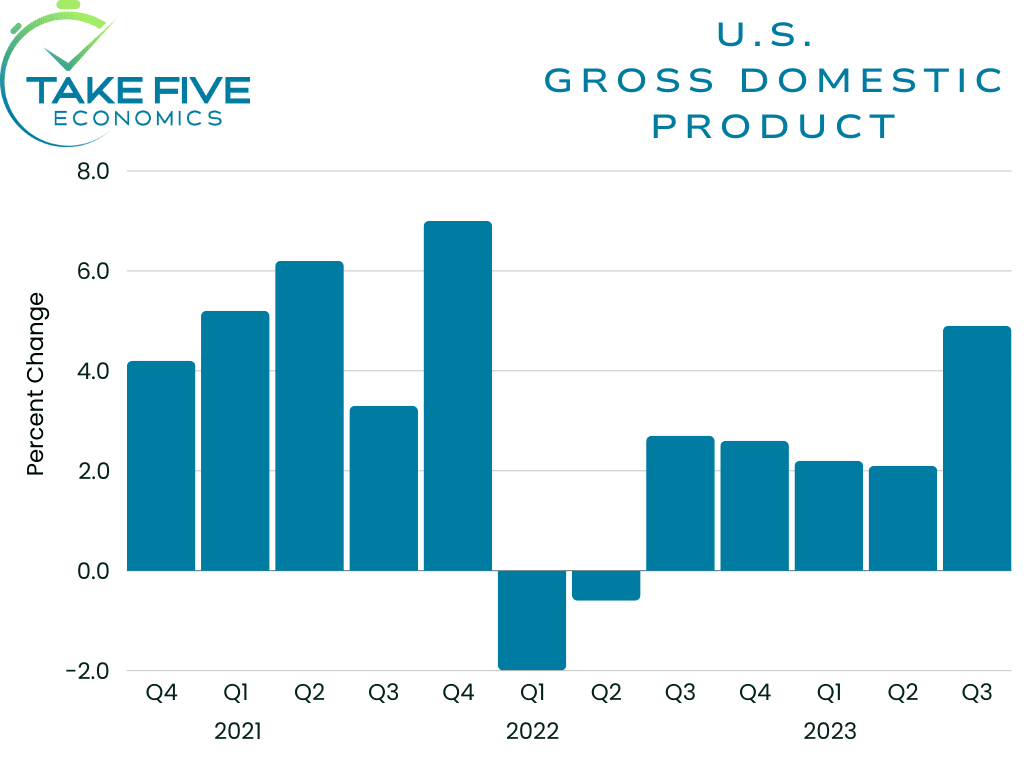
Real GDP increased at an annual rate of 4.9%, absolutely shattering both Wall Street’s and our own expectations, and followed a 2.1% increase in Q2. The GDP Chain Deflator (a measure of the average increase in prices for all domestic personal consumption, and is calculated by dividing nominal GDP by real GDP) was up 3.5% compared to 1.7% in Q2, beating both Wall Street’s and our own expectations.
Finer Details:
PCE:
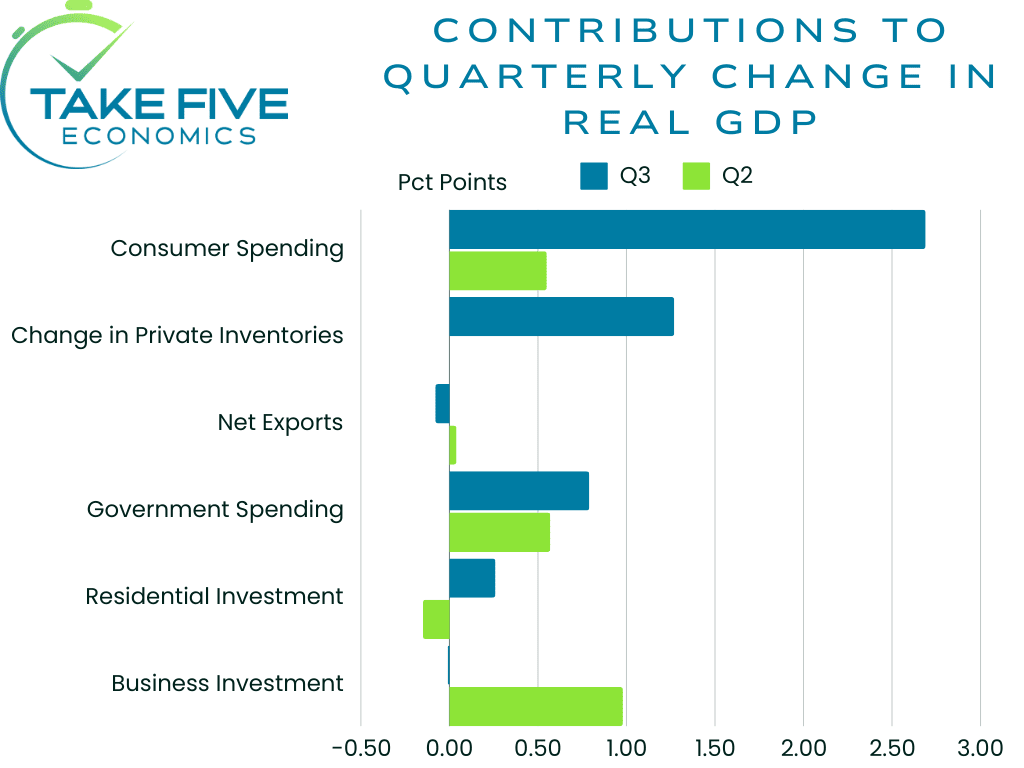
Personal consumption expenditures (PCE) grew at a whopping 4.0% compared to 0.8% in Q2, and contributed 2.69 percentage points to overall GDP, the most by far. PCE is basically just a fancy term for consumer spending, meaning consumers spent at a blockbuster rate that will likely be very difficult to maintain. The report showed that consumers saved less, with the personal savings rate falling from 5.2% in Q2 to 3.8% in Q3 while their inflation adjusted incomes (real disposable income) fell by -1.0% over the summer as well. This could mean that the pace of spending could ease in the coming months, with overall business investment also stalling (see more below). This, along with rising long-term interest rates, escalating geopolitical conflicts, among other things could cause economic cracks to emerge.
The Fed held rates steady at their previous meeting and have signaled they plan to do so at their next one as well. Fed Chair Jerome Powell has cited progress on lowering inflation and the run up in longer term bond yields (which has essentially done some of the tightening for them) as the potential reasons to hold rates. Inflation has been easing significantly from its peak in June of last year. This report showed that core PCE inflation rose at 2.4% in Q3 compared to 3.7% in Q2.
Private Investment:
A buildup in private inventories also contributed to a large portion of Q3 GDP growth. The index grew at an 8.4% clip compared to 5.2% in Q2, and contributed 1.47 percentage points to the overall report. This report showed that business investments in items such as buildings and equipment were essentially flat. Higher long-term interest rates, as history shows, will likely cause a cooling (at the least) throughout several parts of the economy, business investment being one of them. Smaller businesses are also reporting that they’re having a much harder time accessing credit, according to a survey from the NFIB.
Residential investment, which was weak earlier in the year, advanced 3.9% in Q3. But a climb in mortgage rates to near 8% could weigh on that category as demand for homes slide, especially heading into the winter months. The higher yield for the 10-year treasury is extremely noteworthy, as it influences borrowing costs for most consumer-focused loans, e.g. mortgages, credit cards, auto and business loans.
Imports & Exports:
The U.S. trade deficit in goods widened by another 1.3% in Q3, but exports themselves rebounded as well as imports, but the gains in exports were offset by the increase in imports. Exports gained 6.2% in Q3 compared to -9.3% in Q2. This was mostly driven by goods exports, which saw an increase of 7.5% compared to a -16.1% drop in Q2. Imports grew 5.7%, compared to a -7.6% decline in Q2, and was driven by imported goods compared to imported services. Putting it all together, this subtracted -0.08 percentage points from the report, i.e. it contributed very little. It is good to see however the U.S. attempting to bring back some kind of manufacturing infrastructure with the Taiwan Semiconductor plant in Arizona, as well as the major oil companies cutting foreign assets and exchanging them for ones either in, or close to the home front. Maybe these are the first steps towards the U.S. attempting to close that trade deficit.
Government Spending:
Government spending growth was 4.6%, up from 3.3% in the second quarter, and contributed 0.79 percentage points to growth. State and local government contributed slightly more to the overall GDP than Federal, but spending growth cooled from Q2 from 4.7% to 3.7%. Federal spending increased from 1.1% to 6.2%, mostly coming from an 8.0% increase in defense spending, which is something we’ve seen and discussed in our analyses of the industrial production and capacity utilization reports and have noted it was something to keep an eye on moving forward.
IV
Market Psychology & Final Thoughts:
Psychology:
Following yesterday’s GDP data, this will likely give the bulls even more of an advantage and give them an edge moving forward in terms of the balance of power. But if market participants take this GDP data as inflationary, then the edge is in favor of the bears. Yesterday market participants didn’t have a good reaction, today is a different story as markets are more mixed than anything else but it’s hard to distinguish.
Final Thoughts:
Markets are mixed following the open, with the S&P and Nasdaq edging up while the Dow is sliding. European markets are mostly down with the exception of Germany. Bond yields are edging up along with crude oil prices as well, but they are tempering so today's outlook is rather murky following the PCE data, which I’ll cover on Monday. We hope you found this helpful, learned a thing, and have a great Friday, and grand weekend.