The Take Five Report: 10/30/23
I
Markets:
I-I
Global Market Recap:
United States:
- S&P: -0.48%
- Dow: -1.12%
- Nasdaq: +0.38%
- Russell 2k: -1.21%
U.S. markets opened Friday’s session on a positive note, the Nasdaq more so than the other major indexes. Prices would slide throughout the day, with a few failed pushes from bulls. The Dow, S&P, and Russell 2000 would finish in the red, but tech stocks within the Nasdaq managed to keep it afloat.
Asia:
- Shanghai: +0.12%
- Hong Kong: +0.04%
- Japan: -0.95%
- India: +0.52%
Asian markets kicked off the week this morning mixed ahead of monetary policy decisions from the BOJ and Malaysia, as well as inflation data from South Korea and GDP figures from Taiwan and Hong Kong. Japan’s Nikkei 225 fell nearly -1% as the BOJ’s two-day meeting started today.
Europe:
- UK: -0.86%
- Germany: -0.30%
- France: -1.36%
- Italy: -0.80%
European markets closed largely lower in Friday’s session, with France’s CAC 40 pacing the decline. This followed more downbeat earnings from companies within the region as well as the ECB’s decision to hold their policy rate the day prior.
I-II
U.S. Sectors Snapshot:
- Communication Services: -0.36%
- Consumer Discretionary: +1.05%
- Consumer Staples: -1.36%
- Energy: -2.40%
- Financials: -1.81%
- Health Care: -1.69%
- Industrials: -0.88%
- Info Tech: +0.58%
- Materials: -0.04%
- Real Estate: -1.58%
- Utilities: -1.89%
II
Technicals:
II-I
Volatility Index: (VIX)
Weekly Chart:
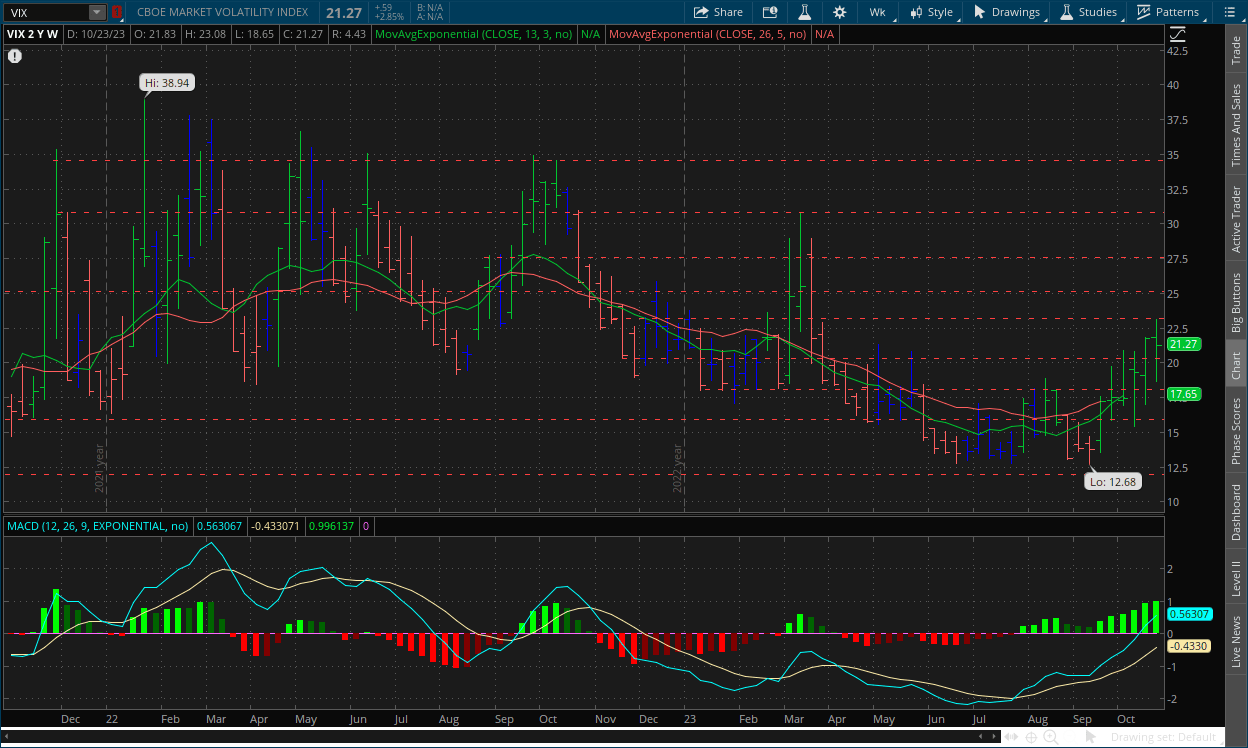
The VIX opened the week near the previous week's close at $21.83. Prices rallied to a high of $23.08, but this week’s range was wide, as a low was found at $18.65, and prices would close a few ticks below the opening price at $21.27.
Inertia continued to shift in favor of the VIX bulls, with the fast EMA (green line) moving above the slow EMA’s (red line) price level for the first time since the week of 9/12/22. Strength moved in favor of the VIX bulls once again as the indicator is continuing to reach new highs. But remember, the MACD-H as it pertains to the VIX struggles to move higher beyond this point, and typically signals a point of reversal and acts as a resistance level for the indicator. The trend the VIX bulls have created has been strong, but it likely doesn't have too much gas left.
Daily Chart:
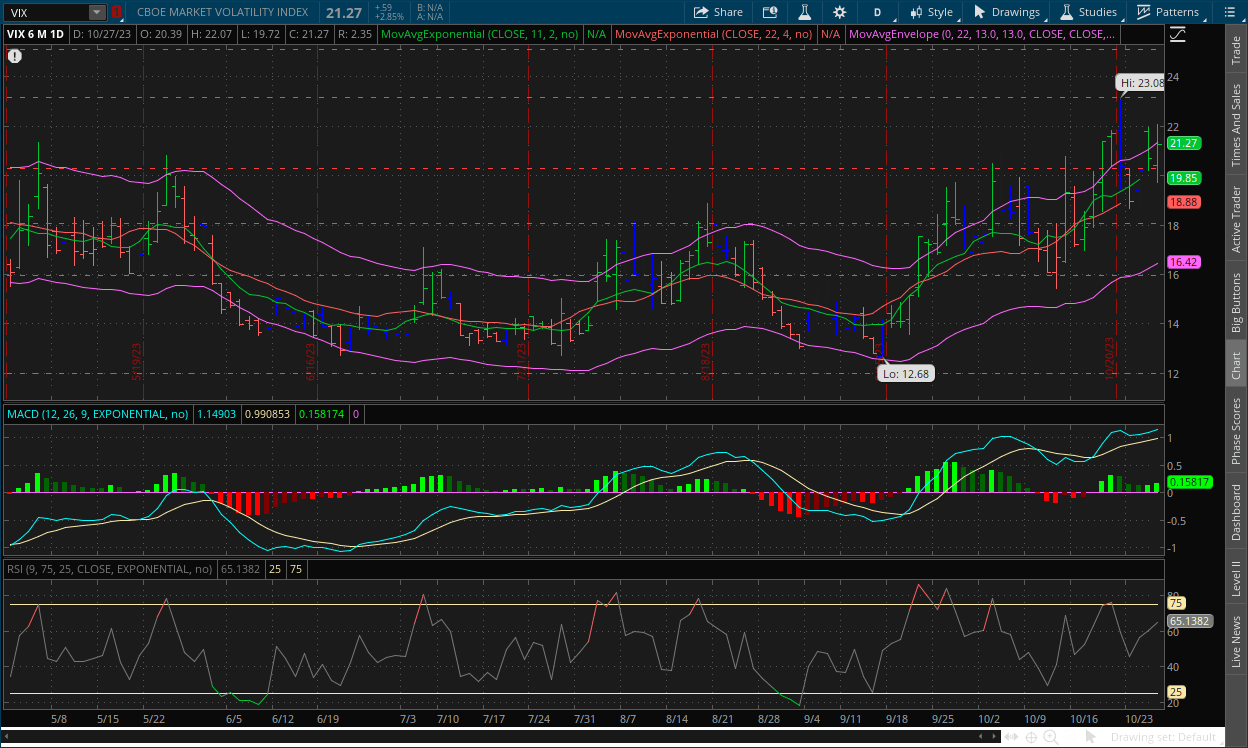
Inertia continued shifting more in favor of the VIX bulls as price bottoms get higher and higher, although do note that price action is becoming weaker as new highs are becoming less frequent. Strength continued to rebound in favor of the VIX bulls, but only slightly as they’re struggling to gain the momentum they had in the early stage of this cycle. The bearish divergence in strength also supports the thesis stated above, i.e. that there’s only so much room left for the MACD-H to climb before some sort of pullback. Since the divergence is on the daily chart and not the weekly, it gives the signal of the next move that will likely happen on the weekly chart and it's more overall trend. The two charts' technical signals are confirming each other.
II-II
S&P 500: (SPX)
Weekly Chart:
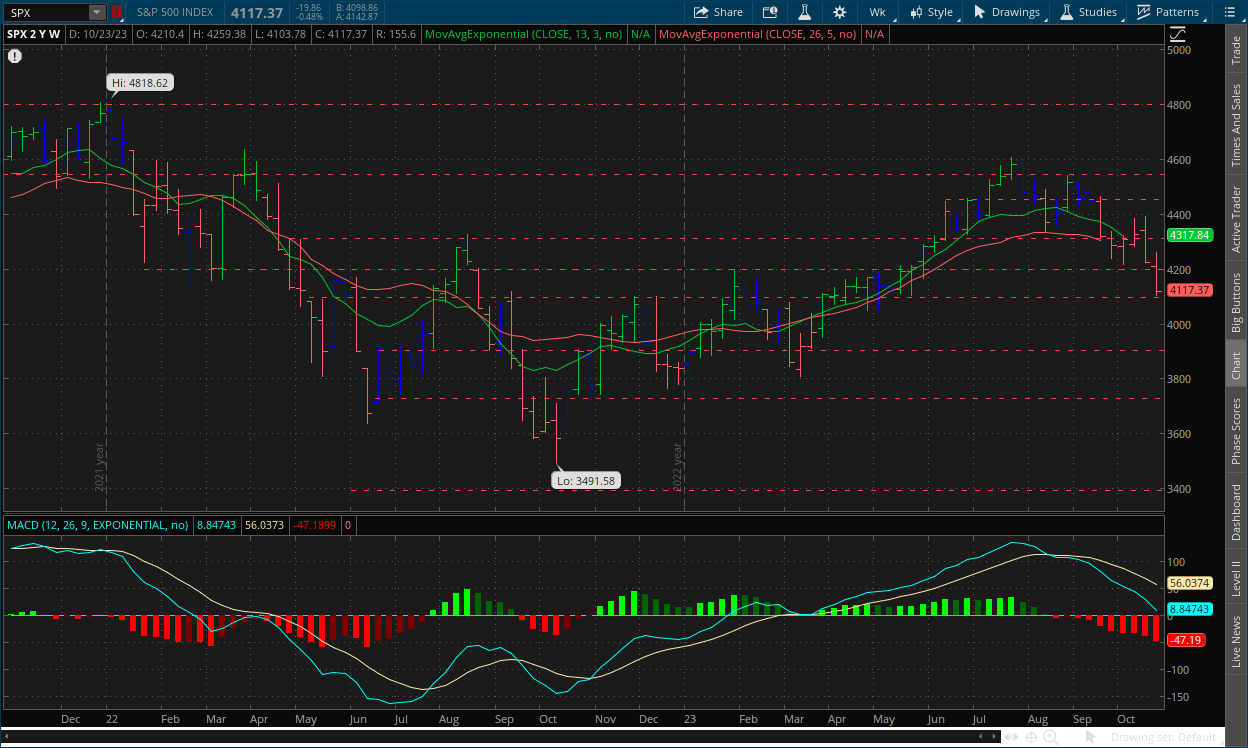
The S&P opened the week lower at $4,210. Prices found a high of $4,259 early in the week but it was all bulls from there as a low was found at $4,103 before closing at $4,117 on Friday.
Inertia continued its shift downwards in favor of the bears as they continued to push prices lower. Strength moved convincingly in favor of the bears once again after a few weeks of consolidation. Like the VIX’s MACD-H however, the S&P’s is getting close to a point where the indicator would typically reverse for at the very least, a short-term pullback. But again, at the very least.
Daily Chart:
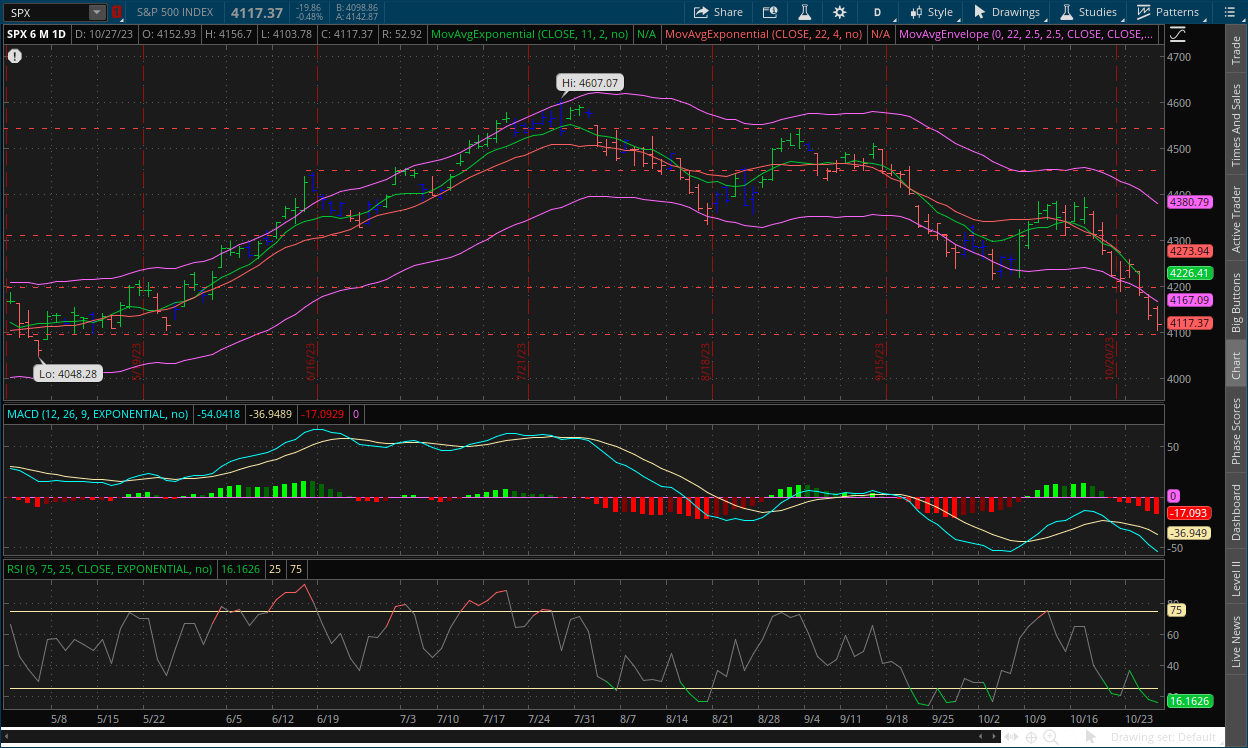
Strength continued to move in favor of the bears and hasn’t shown any signs of letting up quite yet as momentum is strong while inertia also continued its descent. The development of the bullish divergence in the MACD-H’s daily chart is getting less and less likely, which could be a good sign for bears, and may give the bearish divergence on the VIX an increased chance of getting the Hound of Baskerville signal. The $4,100 support level is the next key test, but a short pullback or consolidation period is still likely in the cards sooner rather than later before markets decide where they will go next, our bet is back to the upside.
III
Fundamentals:
III-I
Headlines:
1.) MarketWatch: UAW escalates strike against GM after landing tentative deals with Stellantis and Ford
2.) MarketWatch: Big Tech earnings have been strong but Apple is about to answer the thousand-dollar question
- T5 Note: i.e. Are consumers still so willing to purchase thousand-dollar iPhones in the current economy?
3.) Wall Street Journal: Oil prices slip on hopes conflict won’t spread
4.) Wall Street Journal: Israeli forces make major advance toward Gaza City
5.) Bloomberg: Traders abandon China’s ‘Copper King’ as metals woes spread
6.) Financial Times: Europe’s top banking supervisor says fragmenting market raises risks
III-II
PCE Data for September:
Highlights:
|
Index: |
August: |
September: |
Wall Street Expectations: |
Take Five Expectations: |
|---|---|---|---|---|
|
PCE: |
0.4% |
0.4% |
0.3% |
0.4% |
|
Core PCE: |
0.1% |
0.3% |
0.3% |
0.3% |
|
Personal Income: |
0.4% |
0.3% |
0.4% |
0.3% |
|
Personal Spending: |
0.4% |
0.7% |
0.5% |
0.6% |
Headline & Core PCE:
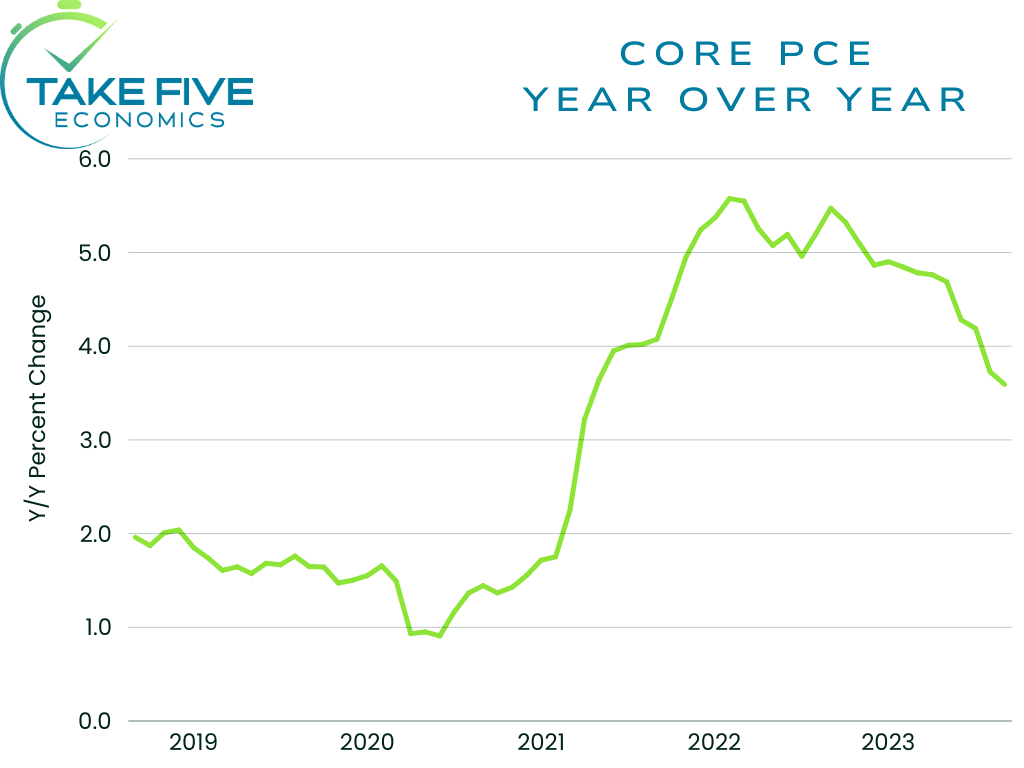
Headline PCE came in at 0.4% in September, remaining unchanged from August and was slightly hotter than Wall Street expectations and matched our own. Headline PCE was up 3.4% year over year, again remaining unchanged from the prior report.
Core PCE, which excludes food and energy and is the Fed’s preferred inflation gauge, rose 0.3% month over month, matching Wall Street’s and our own expectations, and was up 3.7% year over year, cooling slightly from August’s figure of 3.7%.
Personal Income & Spending:
Personal Income increased 0.3% month over month following a 0.4% increase in August, and was slightly below Wall Street’s expectations and matched our own.
Personal spending jumped 0.7% month over month compared to 0.4% in the prior report and came in much hotter than Wall Street’s expectations and above our own as well. This wasn’t surprising given what was in Thursday’s GDP report.
Finer Details:
Personal Saving & Outlays:
The $138.7 billion increase in current-dollar PCE in September reflected an increase of $96.2 billion in spending for services and a $42.5 billion increase in spending for goods. Within services, the largest contributors to the increase was the index for ‘other services’ (led by travel), housing and utilities (led by housing), health care, and transportation (led by air transportation). Within goods, other nondurable goods (led by prescription drugs) and motor vehicles and parts (led by new motor vehicles) were the leading contributors to the increase.
Personal outlays, the sum of PCE, personal interest payments, and personal current transfer payments, increased $175.1 billion in September. Personal saving was $687.7 billion in September and the personal saving rate - personal saving as a percentage of disposable personal income - was 3.4%.
Prices:
The PCE price index for September increased 0.4%. Prices for goods increased 0.2% and prices for services were up 0.5%. Food prices increased 0.3% and energy prices gained 1.7%. The price index advanced 3.4% year over year, with prices for goods increasing 0.9% and services increasing 4.7%.
Putting It Together:
This report didn’t really have any surprises from what we could see, as most of it was in line with the GDP report from Thursday. The key takeaway from it, like the GDP, was that the consumer was strong, and practically carried the economy on their back. Most of the spending came from services over goods, e.g. travel, concerts, and other forms of entertainment.
Headline PCE and core PCE had a sticky feel to them, meaning they lacked a stronger trend of disinflation. That is apt to keep the Fed in a more hawkish mindset, which doesn't mean the Fed will be moved to raise rates soon. What it does mean is that the Fed won't be thinking about a rate cut anytime soon. This is to be expected however, and we don’t think this is cause for too much concern yet, nor will it be in the long-term. The recent rise in inflation expectations was definitely a surprise, but not out of the ordinary, and we believe that number will likely return to trend barring some kind of shock.
IV
Market Psychology & Final Thoughts:
Psychology:
The balance of power between bulls and bears is becoming more even. The technicals are at a point where the bulls can start to gain some ground back while the bears have limited room to move based on the indicators themselves. The $4,100 level will be a key psychological point that bulls want to stop prices from moving below and bears will want to push past because a true breakout below it will officially wipe away all of the progress the benchmark index has made over the last six months.
Despite the escalation of conflict in the Middle East, market participants' minds have eased on it possibly spreading. This won’t happen overnight, we just think that this is one of those things that people want to have a short-term memory about because it’s one of those things that could actually break markets.
Final Thoughts:
Futures are climbing as we head towards the open with European markets gaining good ground as well. Crude prices are down in the U.S. and with Brent crude but European oil is rising due to Egypt saying imports have stopped. Bond yields are also on the rise, and over the last few days we’ve seen futures gain some ground in premarket trading only for markets to swiftly drop at the open. All in all, it makes today’s setup rather murky. This will be a big week for earnings and for the labor market as key reports will be coming out across the board. We hope you found this helpful, learned something different, and kick off the week on sound footing.